What's new in v8

v8 ships the sfdx-hardis plugin and the VS Code extension together.
The headline is Deployment Actions leaving beta. But there is a lot more:
| What changed | Why you care |
|---|---|
| VS Code extension rebuilt | One consistent design, readable tables, and a command panel that shows a whole run on a single screen |
| Everything runs faster | Save / Publish my User Story reaches its first question in 5 seconds instead of 16 |
| Deployment Actions are generally available | Everything that must happen around a deployment is declared on the Pull Request and runs by itself, in every org |
| Promotion branches (Beta) | Ship only the approved User Stories to production, with their deployment actions, tests and release notes |
| Backpromote (Beta) | Bring what your teammates merged into your developer sandbox, by hand or with a coding agent |
| Scratch org pool in your git provider | Scratch orgs ready in seconds, stored encrypted in your git provider, with a dashboard and a VS Code panel |
| Org initialization (Beta) | One ordered list of steps sets up every new scratch org and sandbox, configured from a VS Code panel |
| Replacement rules (Beta) | Endpoints, emails and secrets set per org at deployment time, and the XML elements an older org refuses removed for you |
| Pull Requests explorer | Find any Pull Request and read its tickets, actions, validation and deployment results in VS Code |
| Metadata dependencies | See what uses an Apex class, a Flow or a field before you change or delete it |
| Pull Request comments redesigned | You know in one second which comment you are reading and how the deployment went |
| Smaller footprint, safer supply chain | Half the npm packages removed: faster installs and fewer dependencies to trust |
| Personal data anonymized | Names, emails, user Ids and IP addresses are pseudonymized in every report and every notification channel |
| Usage and cost monitoring | Entitlements, consumption alerts and Agentforce credits, in percentages and in your own currency |
| Ask a coding agent | Your monitoring repository explains itself to a coding agent, which answers about the org and the pipeline |
| Sandbox refresh covered end to end | Connected Apps, Scheduled Apex and restores that survive a failure |
| Flow deletion in destructive changes | Deleting a Flow no longer means a manual step in every org |
| Pipelines run in the Docker image | Faster jobs that a bad dependency release can no longer break |
| Free training with badges | A free course builds a complete pipeline on free orgs, click by click, and awards a badge per level |
| Professional support by Cloudity | Still free and open-source, with setup, support subscriptions and Release Manager as a Service if you need them |
The VS Code extension got a full redesign
Every panel now shares the same header, the same cards and buttons, the official Salesforce color palette, and colors that stay readable in both light and dark themes.
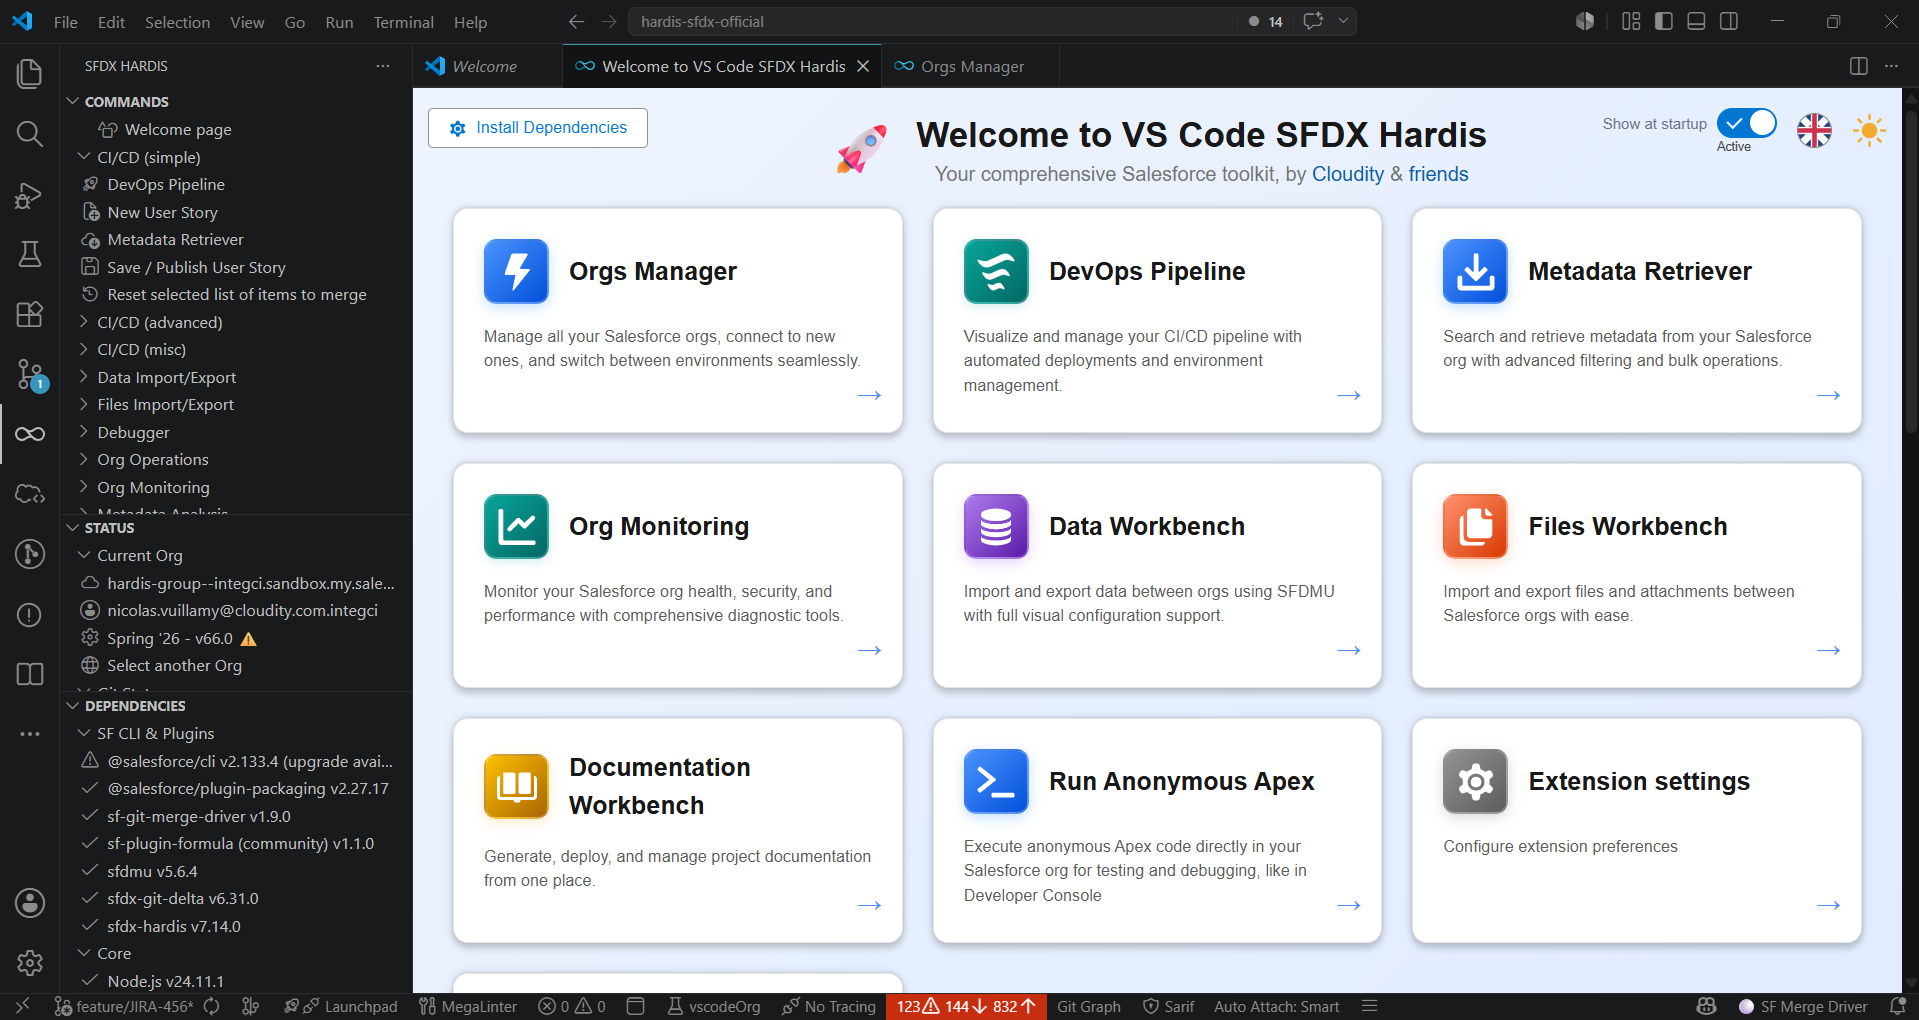
- The Welcome page shows your setup status at a glance: the Install Dependencies button becomes a live status, and is highlighted only when something actually needs you.
- Tables are easier to scan everywhere: alternate row colors, status as colored pills, initials avatars, branch chips, short dates. Right-click any cell to copy its value.
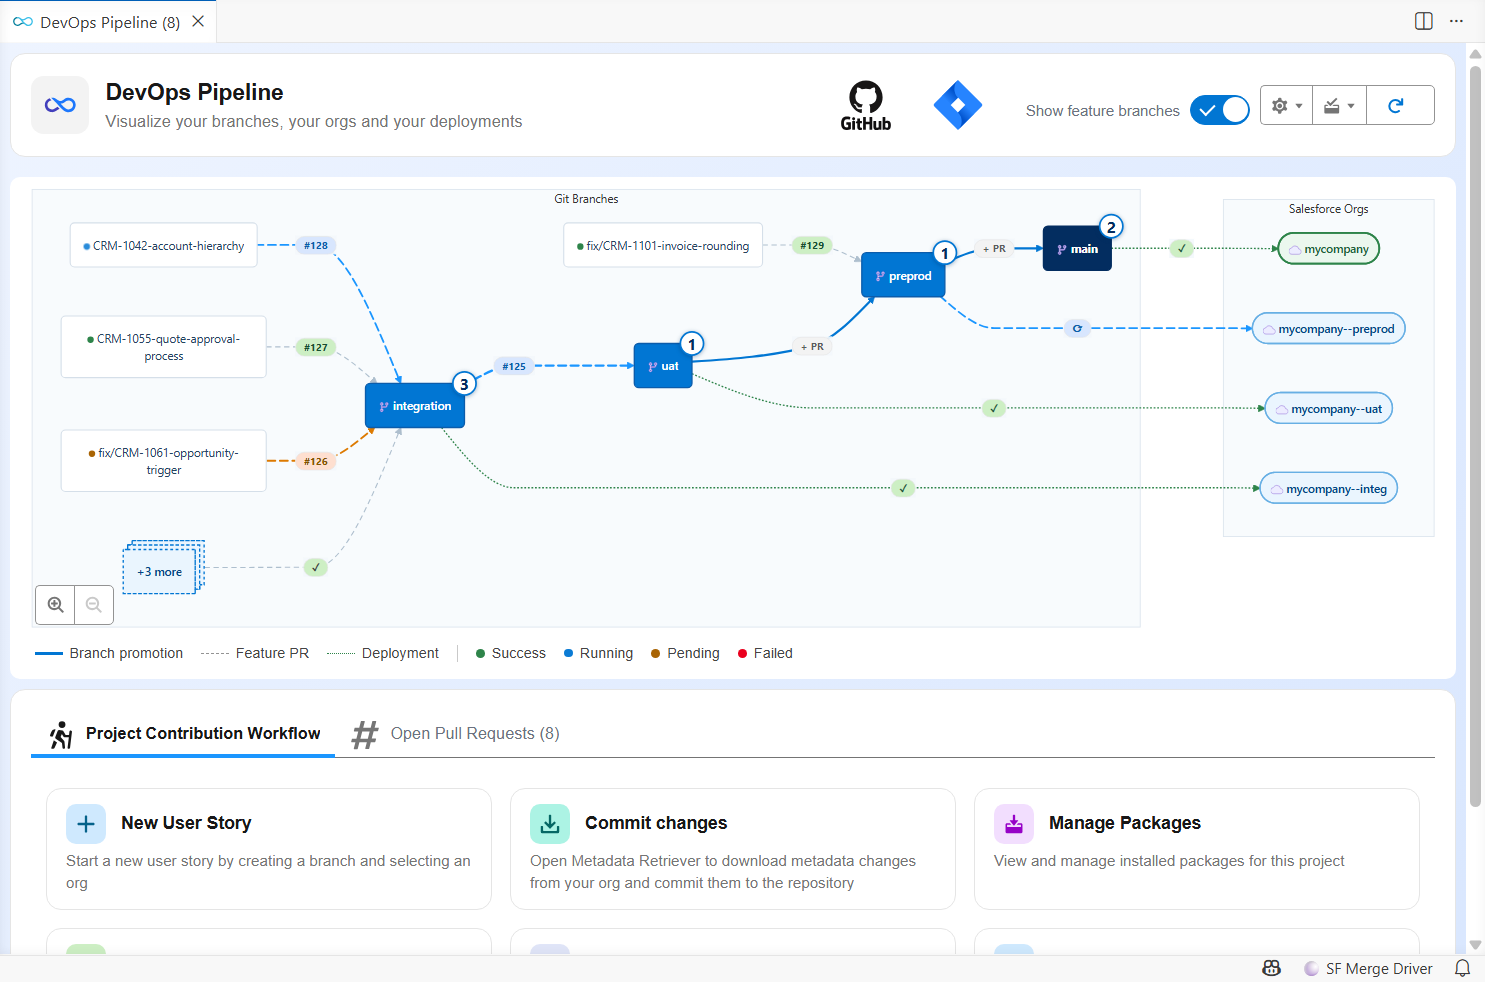
- In the DevOps Pipeline diagram, CI job status is color-coded consistently: blue animated for running, orange for pending, red for failed, green for success.
- The command execution tab now shows a whole run as a compact timeline that fits on one screen, with the command name, its status, the org it runs on, the elapsed time and a link to the log file.
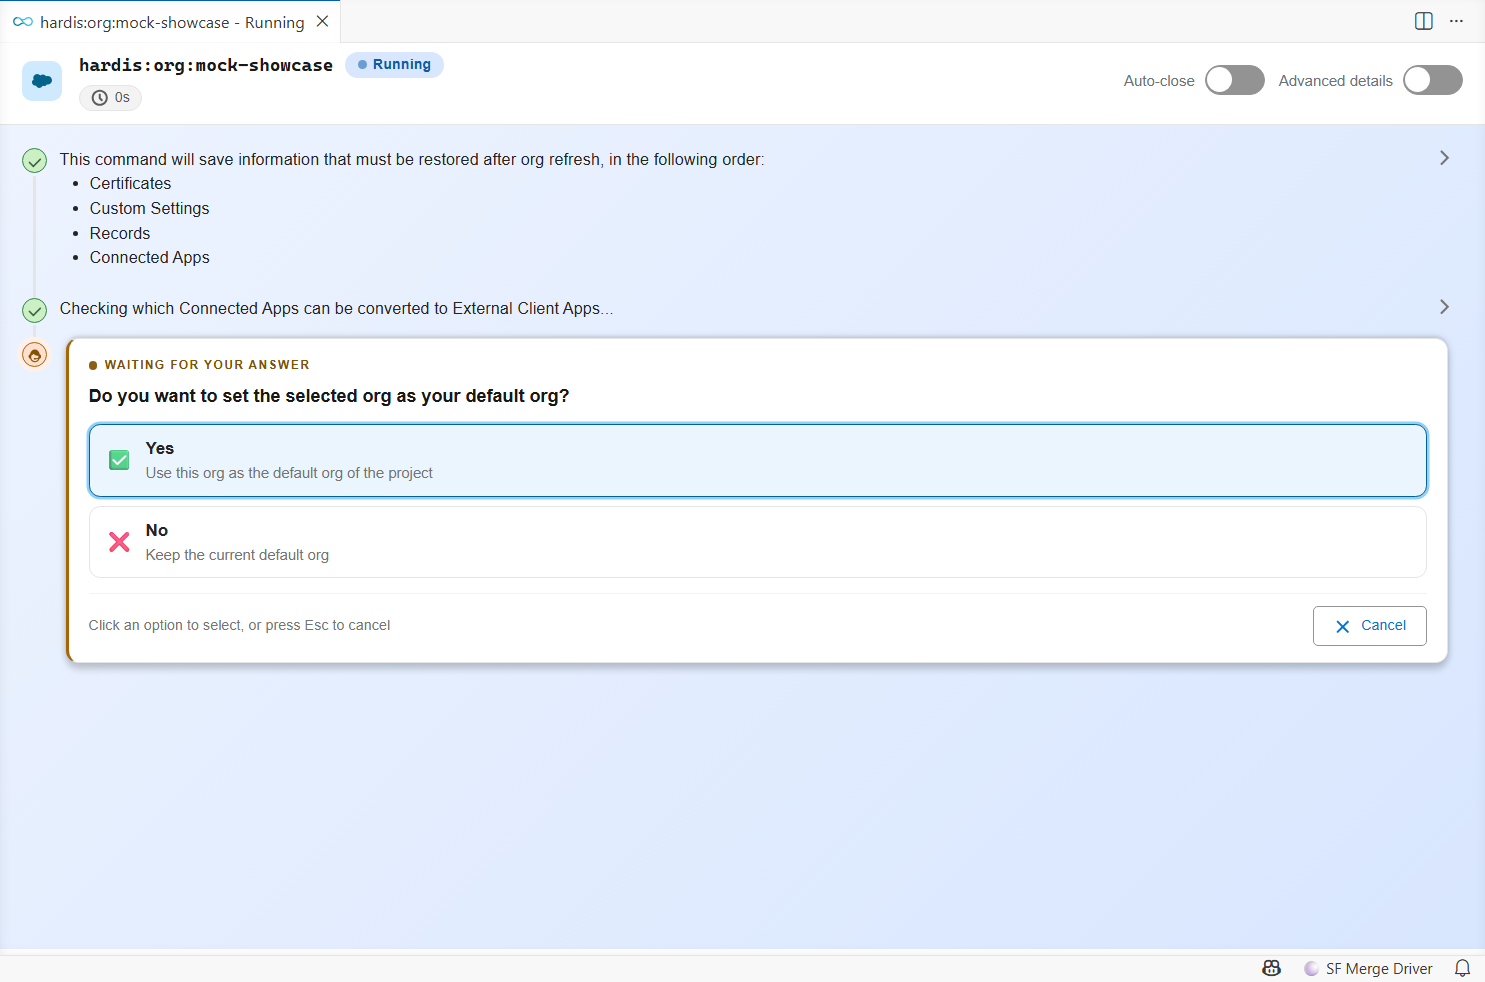
- Questions are highlighted, long choice lists are searchable in place, and answered questions collapse to a single line showing your answer.
- Log lines carrying a big JSON or a very long text show only their beginning: click to expand, copy, or open in a VS Code tab.
- Every query gets a record count chip next to it: a running indicator while it executes, then the number of records it returned, or Query failed. SOQL, Tooling API, Bulk API and Data Cloud queries all report it.
- Once a command is over, Run again replays it with the same parameters.
- Hovering any table cell shows its full value, so a long text cut off by a narrow column stays readable.
- The Install Dependencies panel offers an Upgrade button that installs the required version, instead of a link to the repository, when your sfdx-hardis plugin is too old.
- Extension Settings are readable at last: real setting names, and each description visible under its name instead of hidden behind a hover icon.
- Panels follow your VS Code theme by default, so they no longer open in light mode inside a dark VS Code.
Your orgs, color-coded

- A status bar badge spells out the type of your default org: PROD, MAJOR, SANDBOX, SCRATCH or DEV ORG. Click it to open the Orgs Manager.
- The new Org color mode setting chooses how much of the window is colored: status bar only (the new default), title bar too, or the whole activity bar as before.
- Select color for current org now offers a palette with a live preview, instead of asking you to type a color code.
Find any command
- 7 new commands in the Commands panel: MFA Readiness, Unsecure Permissions, Usage-Based Entitlements, Consumption Alerts, AI Credit Usage, Run Agentforce Tests and Data Dictionary.
- A new Search button lists commands from every category and filters as you type, including 17 extra commands that are not displayed in the panel, like Deployments history analysis, Org licenses, Create sandbox org or Data Cloud SQL query.
Everything runs faster
Waiting was the most common complaint about the extension. v8 attacks it from both sides.
| What you do | v7.23 | v8 |
|---|---|---|
| Click Save / Publish my User Story, wait for the first question | 16 s | 5 s |
| See the command switch from Starting to Running | up to 5 s | about 1 s |
| Save a User Story with three automatic cleanings | 30 s of cleaning | a few seconds |
| Open a panel showing org information | 3 to 4 s each time | instant |
| Open the Data or Files workbench on a project with large exports | VS Code frozen | opens right away |
Clicking a command no longer means waiting
The biggest one: clicking Save / Publish my User Story or New User Story took 16 seconds to ask its first question. Ten of those seconds were spent doing strictly nothing, because of a handshake between the extension and the command that never completed. It is fixed on both sides, so you now get your first question in about 5 seconds.
The rest follows: the command panel says Running about a second after your click instead of sitting on Starting, and the org check that printed "You are already connected as..." before every single command is gone.
Where the 16 seconds went
Measured end to end on hardis:work:save, with a bench harness spawning the real CLI against a mock extension and recording the time of every WebSocket event.
| Phase between the click and the first question | v7.23 | v8 |
|---|---|---|
| Node and oclif boot, WebSocket connect | 0.8 s | 0.8 s |
| Waiting for the extension's go-ahead | 10.0 s | 0 s |
| Loading the command and its dependency tree | 2.7 s | overlapped |
| Org authentication check and configuration read | 1.5 s | 0 s |
| Hooks, flag parsing and git calls | 1.3 s | 1.3 s |
| Total | 16.3 s | ~5.2 s |
The 10 seconds were a missed signal. The command waited for the extension to confirm that its panel was ready, with a 10-second safety timeout. The extension only listened for that "panel ready" signal once the command had connected, but panels open at click time and had already sent it, so the answer never came and every command launched from the UI paid the full timeout. The extension now answers immediately when the panel is already open, and the command loads itself during the wait instead of after it.
The command also announces itself before loading its whole implementation, which is what moves the panel to Running:
| Process launch to the "Running" announcement | v7.23 | v8 |
|---|---|---|
sf hardis:work:new |
5074 ms | 749 ms |
sf hardis:work:save |
3844 ms | 754 ms |
And the extension starts the process differently: directly instead of through Git Bash and the npm sf launcher script, reusing the compiled code of the CLI from one command to the next.
Launch strategy (spawn to first prompt of hardis:work:new, median) |
Time |
|---|---|
| Git Bash and npm launcher script (v7.23) | 1985 ms |
| Direct Node launch | 1664 ms |
| Direct Node launch and compile cache (v8) | 1315 ms |
Org information appears instantly
The org badge, the org color, the Dev Hub lookup, the Orgs Manager list, the Metadata Retriever listings and the queries it runs all used to start a Salesforce CLI process behind your back, and wait 3 to 4 seconds for it to boot. They now answer in milliseconds, using the libraries of the Salesforce CLI already installed on your machine. Anything unusual still runs the real command, so nothing behaves differently.
The Orgs Manager also stops making you wait for the whole list: your orgs appear at once, and the Connected column fills in afterwards.
Measured, against the real Salesforce CLI
Same project, same org, identical JSON returned in every case.
| Command | Salesforce CLI | In-process | Gain |
|---|---|---|---|
sf config get target-org |
2635 ms | 19 ms | 138x |
sf org display --target-org <org> |
2695 ms | 65 ms | 41x |
sf config set target-org=<value> |
2730 ms | 70 ms | 39x |
sf org display |
2843 ms | 225 ms | 13x |
The extension covers sf org list, sf org list metadata and sf data query as well, in a worker thread so the interface stays responsive: sf org list 8x faster, listing 1481 CustomObjects 11x faster, a SOQL query 39x faster.
Every sf process started by sfdx-hardis also skips its log file, its "new version available" check and its autoupdate probe, which saves another 400 to 750 ms per call. Set SFDX_HARDIS_ENHANCE_PERFORMANCE=false, or check Disable performance enhancements when calling sf commands in the extension, to run the plain commands everywhere.
Saving a User Story stops scanning your whole repository
The automatic cleanings applied when you save used to start their own Salesforce CLI, one after the other, and the Flow cleaning went through every Flow of the repository even when your User Story touched none. A project with three cleanings configured gets about 30 seconds back on every save.
Measured on a project of 3235 tracked files
| Operation | Before | After |
|---|---|---|
| One cleaning of hardis:project:clean:references | 11 248 ms | 34 ms |
| Resolving 500 metadata files by name | 2237 ms | 26 ms |
| hardis:lint:metadatastatus source scan | 1708 ms | 216 ms |
| hardis:misc:custom-label-translations source scan | 1579 ms | 606 ms |
purge-references source scan |
342 ms | 192 ms |
The cleanings now run inside the current process instead of spawning a CLI each, the Flow positions cleaning is restricted to the Flows of your git delta and skipped entirely when there is none, and a full pass over the 88 places the plugin walks your sources removed the walks that were scanning node_modules or repeating themselves once per metadata type.
VS Code stops freezing
| Before | Now |
|---|---|
| Clicking a command could wait more than 10 seconds for the Salesforce CLI to boot before showing anything | The execution tab opens immediately on click |
| Commands run in a terminal waited for the terminal to be ready | They start immediately, and use Git Bash automatically on Windows when it is installed |
| VS Code could freeze several times a day after a file was created or renamed | Fixed, and VS Code starts faster |
| Commands clicked right after startup were rejected with "not initialized yet" | They just run |
| Panels could stay stuck on a loading spinner | They load, and a display error shows a Try again button |
| The Data and Files workbenches froze VS Code while they opened | They open right away, whatever the size of your exports |
Searching your sources walked node_modules, and the Metadata Retriever was slow on projects with many types |
Folders holding no Salesforce metadata are skipped, and the sources are read once |
What was slowing them down
- The Data and Files workbenches read every exported CSV whole, byte by byte, just to display a line count. An SFDMU export routinely holds files of several hundred megabytes. Files are now read by chunks, and anything above 50 MB shows Not counted instead.
- Searching the sources passed no exclusion list at all, so
node_moduleswas walked every time..claudeand.cursorare skipped too, which is also a correctness fix: the example metadata their instructions can hold was picked up as source of the project. - The Metadata Retriever ran one walk per metadata type and per package directory, so a retrieve listing 20 types walked your sources 40 times. It now reads them once.
- The extension bundle is just under 1 MB instead of several megabytes: the TypeScript compiler pulled in by a configuration loader is gone, the Git and ticketing providers load on demand, and the 3.3 MB MermaidJS library is loaded only by the panel that draws diagrams instead of every panel, including the Welcome page.
The plugin got its share too: the upgrade check no longer delays startup, hardis:org:purge:flow deletes Flow versions much faster with fewer API calls, and hardis:project:clean:profiles-extract fetches record counts and field extracts concurrently.
New at startup: a warning when the Salesforce Extensions setting Source Tracking: Enable Conflict Detection is on, because it checks conflicts in the background and slows down the whole VS Code. One click disables it.
Expert mode: the questions you always answer the same way
Ships in v8.4.0.
Once you have saved your hundredth User Story, the confirmations stop being useful. Turn on Expert user mode in the extension settings (or set SFDX_HARDIS_EXPERT_MODE=true) and hardis:work:save stops asking whether your metadata is committed, which cleanings to apply, whether to push, and the data export questions. It applies the cleanings listed in autoCleanTypes, pushes, and opens the Merge Request page in your browser.
Questions that ask for a real choice stay, like the target branch when it cannot be guessed.
Deployment Actions are generally available
This is the major enhancement of v8. Deployment Actions were a beta feature of the DevOps Pipeline. They are now a fully supported part of the workflow, in the extension and in the CI/CD jobs.
A deployment action is anything that must happen around a metadata deployment, and that used to be a line in a checklist someone had to remember:
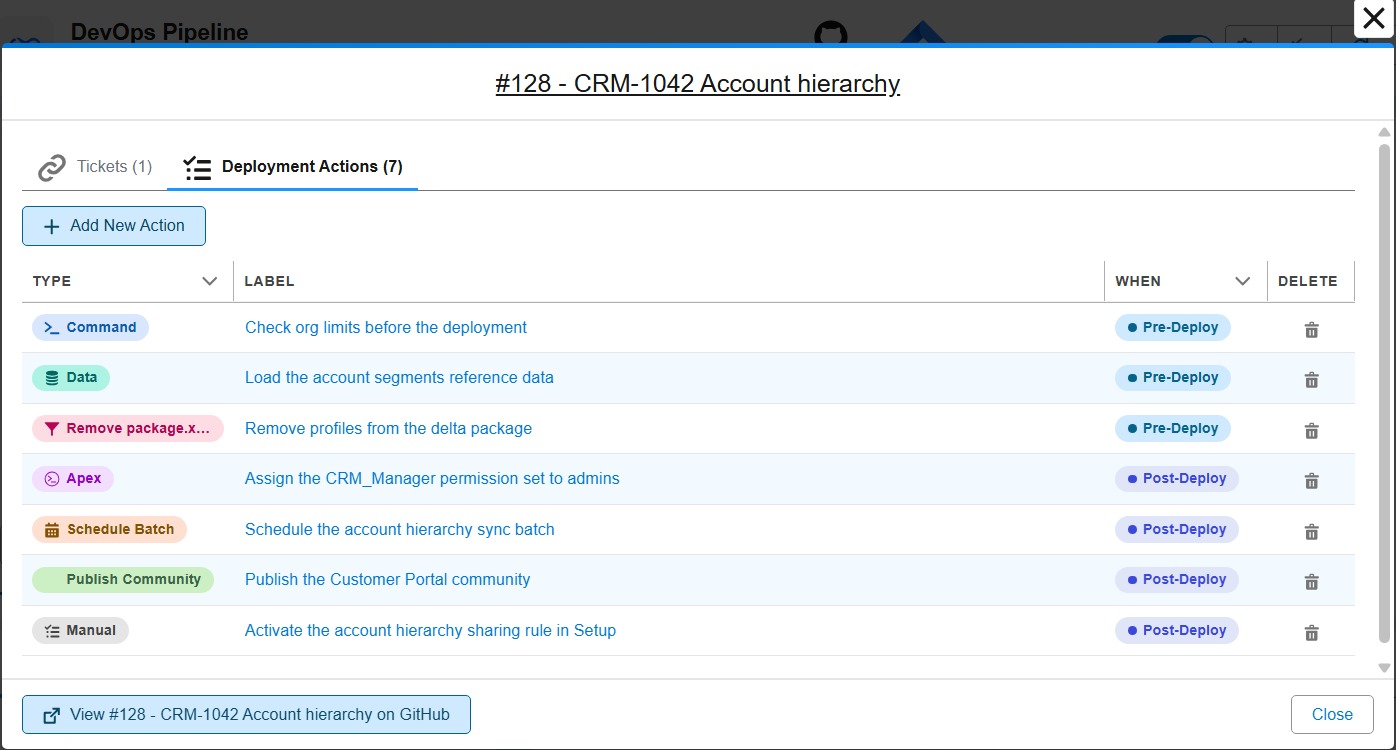
| Action type | What it does |
|---|---|
| Command | Runs a Salesforce CLI or sfdx-hardis command |
| Data | Loads an SFDMU data workspace (reference data, settings records) |
| Apex | Runs an anonymous Apex script |
| Schedule Batch | Schedules an Apex batch with its CRON expression |
| Publish Community | Publishes an Experience Cloud site |
| Remove package.xml items | Excludes metadata from the deployment package |
| Manual | Describes a step a human must do in Setup, and tracks whether it was done |
| Custom function | Runs a node, python or bash script of your project, with typed inputs and outputs |
What you get in v8:
- Declare the actions of your User Story from the DevOps Pipeline, in the Deployment Actions tab of your Pull Request. No YAML to write.
- Restrict an action to the orgs that need it: everywhere, only on some major branches, everywhere except a few, or only on developer sandboxes. The branch selector labels its two columns Runs here and Does not run here, and spells out the result in a sentence, so there is no doubt about whether you picked the orgs that run the action or the ones that skip it.
- A manual action opens with a click-by-click template, because the person replaying it in the next org is rarely the one who wrote it: exact Setup path, exact item name, value to set, and how to check it worked.
- New actions are created with Run only once by org enabled, so an action does not replay at every deployment to the same org.
- Actions now also run when you merge into production, and are replayed downstream when a retrofit branch carries a hotfix to another major branch.
- Follow their execution from the Pull Request: a status matrix with one row per action and one column per org branch, and a checklist of the manual steps still pending. Each action's details are laid out as a properties table and an org-by-org results table, instead of a run of bold key/value pairs.
- Tick a manual action as done directly in a Pull Request comment. The next job records it and ticks the same box in the other comments.
- A failed action now says why it failed, in the job log and in the Pull Request comment. An action declared with
allowFailureshows as a warning, not as a failure, and no longer turns the comment banner red, since the deployment went through. - A Pull Request between two major branches (a promotion) lists the actions declared on the feature Pull Requests it carries, with their author, instead of asking you to declare new ones.
- The validation job of a feature branch only carries its own Pull Request. It used to collect every Pull Request ever merged upstream, 341 of them on one project, and list their manual actions in your check comment.
- Bring your own action types with custom functions: package a node, python or bash script of your repository behind declared inputs, outputs and secrets, and it shows up in the action editor next to
command,apexanddata. Call an internal API, post to a tool your team uses, or anything the built-in types do not cover. - Not for you?
disableDeploymentActions(orSFDX_HARDIS_DISABLE_DEPLOYMENT_ACTIONS) turns the whole feature off.
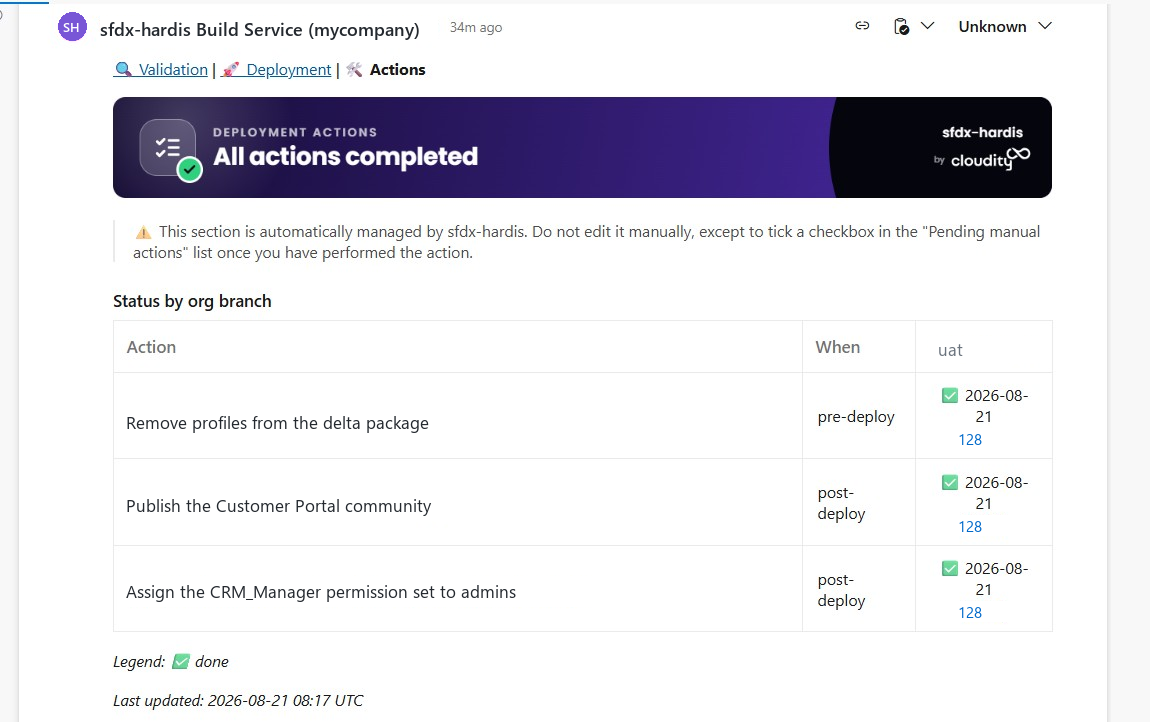
The Deployment Actions guide was rewritten for v8, with one illustrated section per action type.
Promotion branches (Beta): ship only the approved User Stories
With sfdx-hardis you promote branches, not features: everything merged into uat goes to preprod, then to production, together. That stays the recommended way. But when business sign-off happens per User Story and the release date does not move, one unapproved story in uat blocks all the others.
A promotion branch is the way out for that case. From the DevOps Pipeline, the release manager ticks the approved stories of uat and clicks Create promotion. sfdx-hardis cuts a branch from preprod, cherry-picks those stories onto it, and opens an ordinary Pull Request.
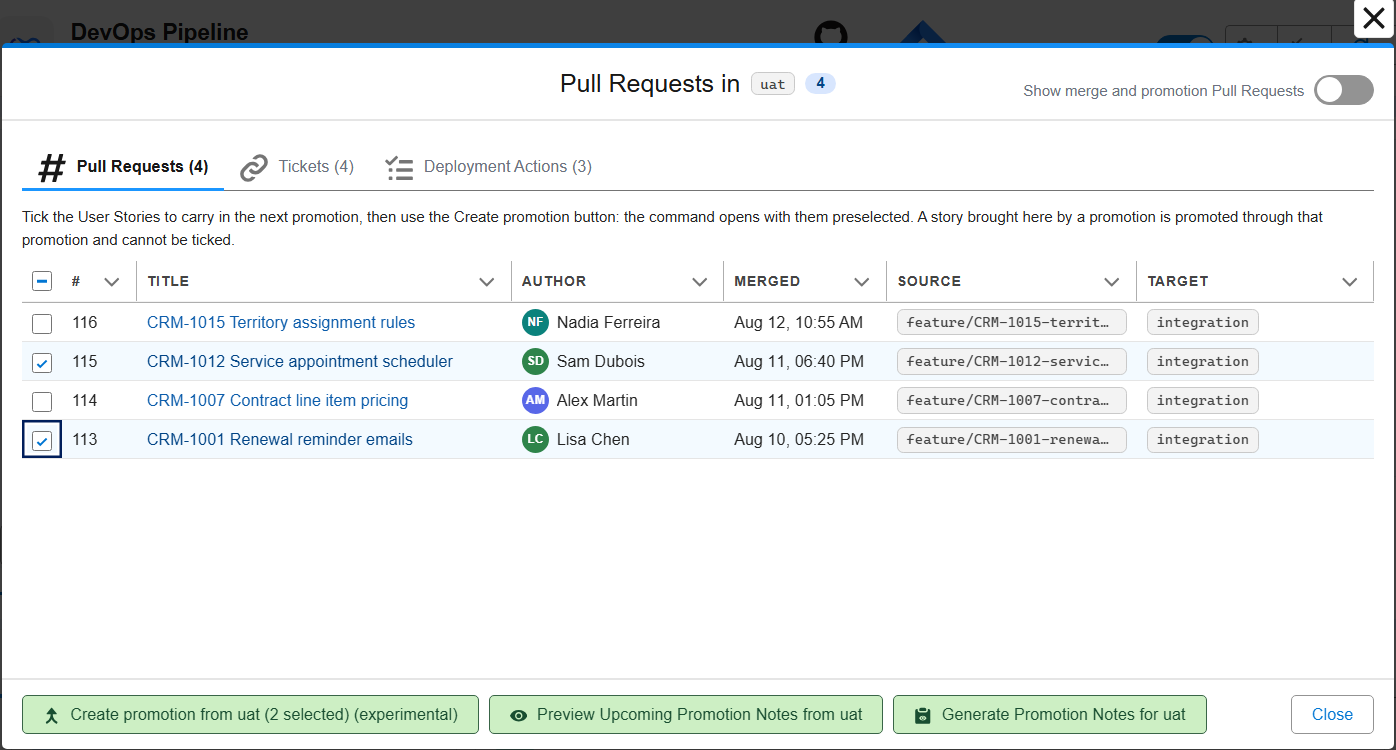
- Nothing is lost on the way: the deployment actions, the Apex test classes, the tickets and the release notes of the stories it carries follow them to
preprodand production. - The open promotion is drawn on the DevOps Pipeline, on the arrow between the two branches.
- A cherry-pick conflict can be answered once for the whole promotion, or handed to a coding agent with a ready-made prompt.
- hardis:project:promotion:list-candidates lists what is waiting to be promoted, for agents and automation.
- Works the same on GitHub, GitLab, Azure DevOps and Bitbucket.
- Off by default: enable it and declare the allowed steps (for example only
uattopreprod) in the Danger Zone of the Pipeline Settings.
Backpromote (Beta): catch your sandbox up with the team
While you work in your developer sandbox, your teammates merge their User Stories in integration. Your sandbox falls behind: the fields, classes and Flows they created are missing, and your next story may conflict with theirs.
A backpromote deploys into your sandbox what the team merged since your last one: the metadata, the deletions, and the deployment actions of their Pull Requests.
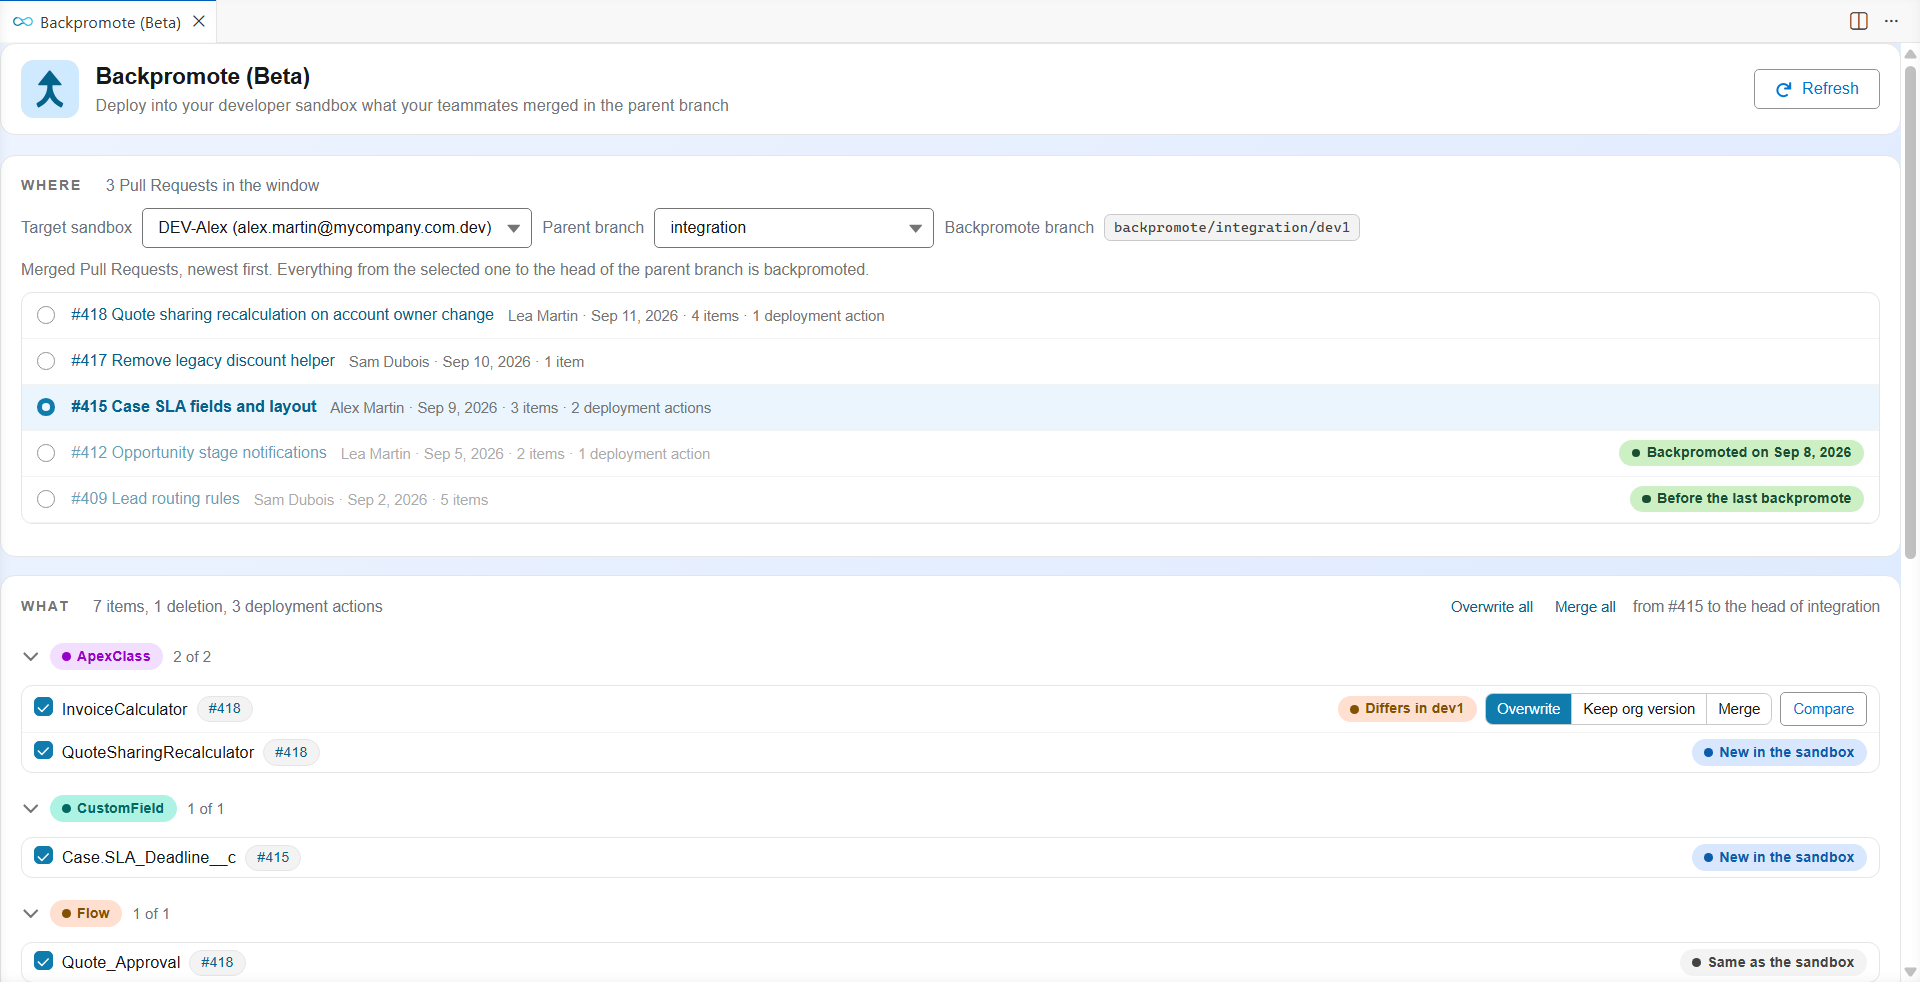
- A panel of its own, opened from the Backpromote card under the DevOps Pipeline: pick the sandbox and the parent branch, read the plan, decide what to do with each file that differs from your work, and follow the deployment.
- With a coding agent, or without: do it all by hand in the panel, let Claude Code, Codex or GitHub Copilot solve the merges and fix the deployment errors, or paste one prompt and let the agent run hardis:work:backpromote from start to end.
- Its history is kept on the Pull Requests, so the next backpromote starts where the previous one ended, from any computer and for everyone sharing the sandbox.
- Production and the orgs of major branches are never offered as targets.
A scratch org pool with no extra infrastructure
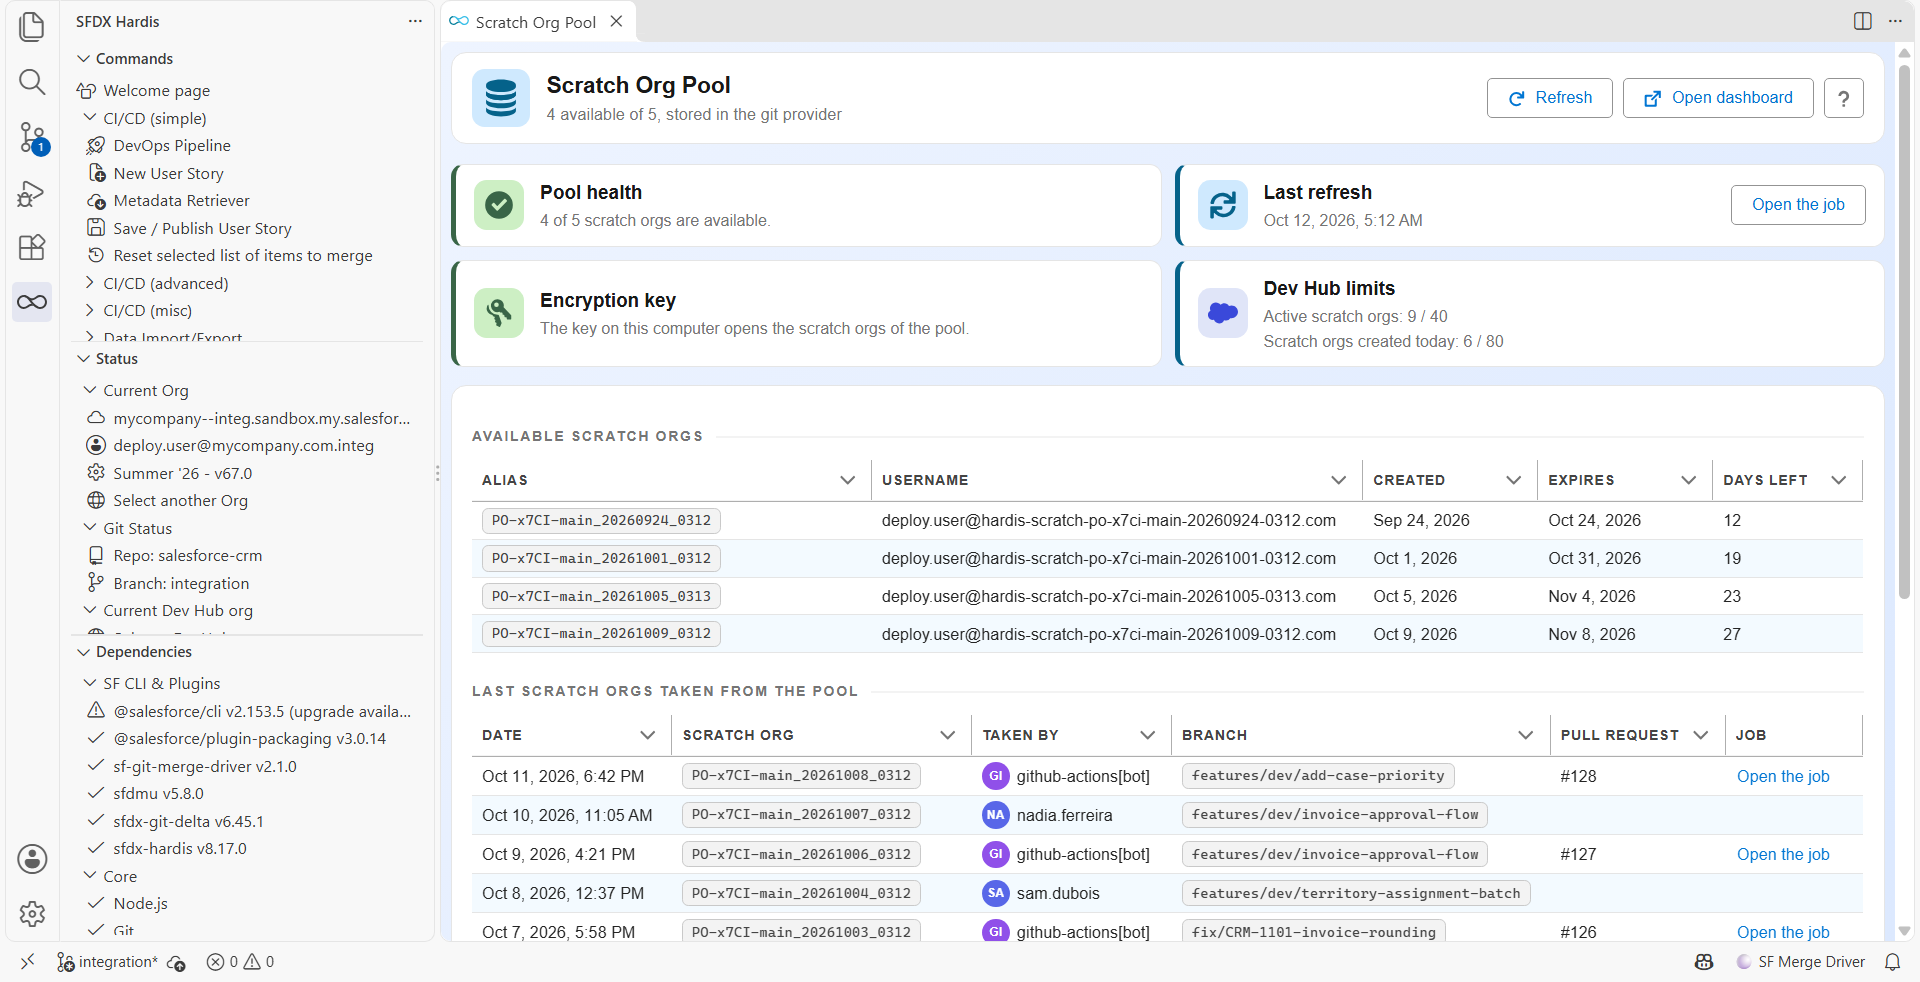
Creating a scratch org, installing its packages and pushing the sources takes minutes, for every Pull Request job and every new User Story. A scratch org pool keeps scratch orgs ready: a scheduled job creates them during the night, and a job or a developer takes one in seconds.
The pool used to need a storage service of its own. It now lives in your git provider: an issue on GitHub and GitLab, a work item on Azure DevOps, a Pull Request that is never merged on Bitbucket Cloud.
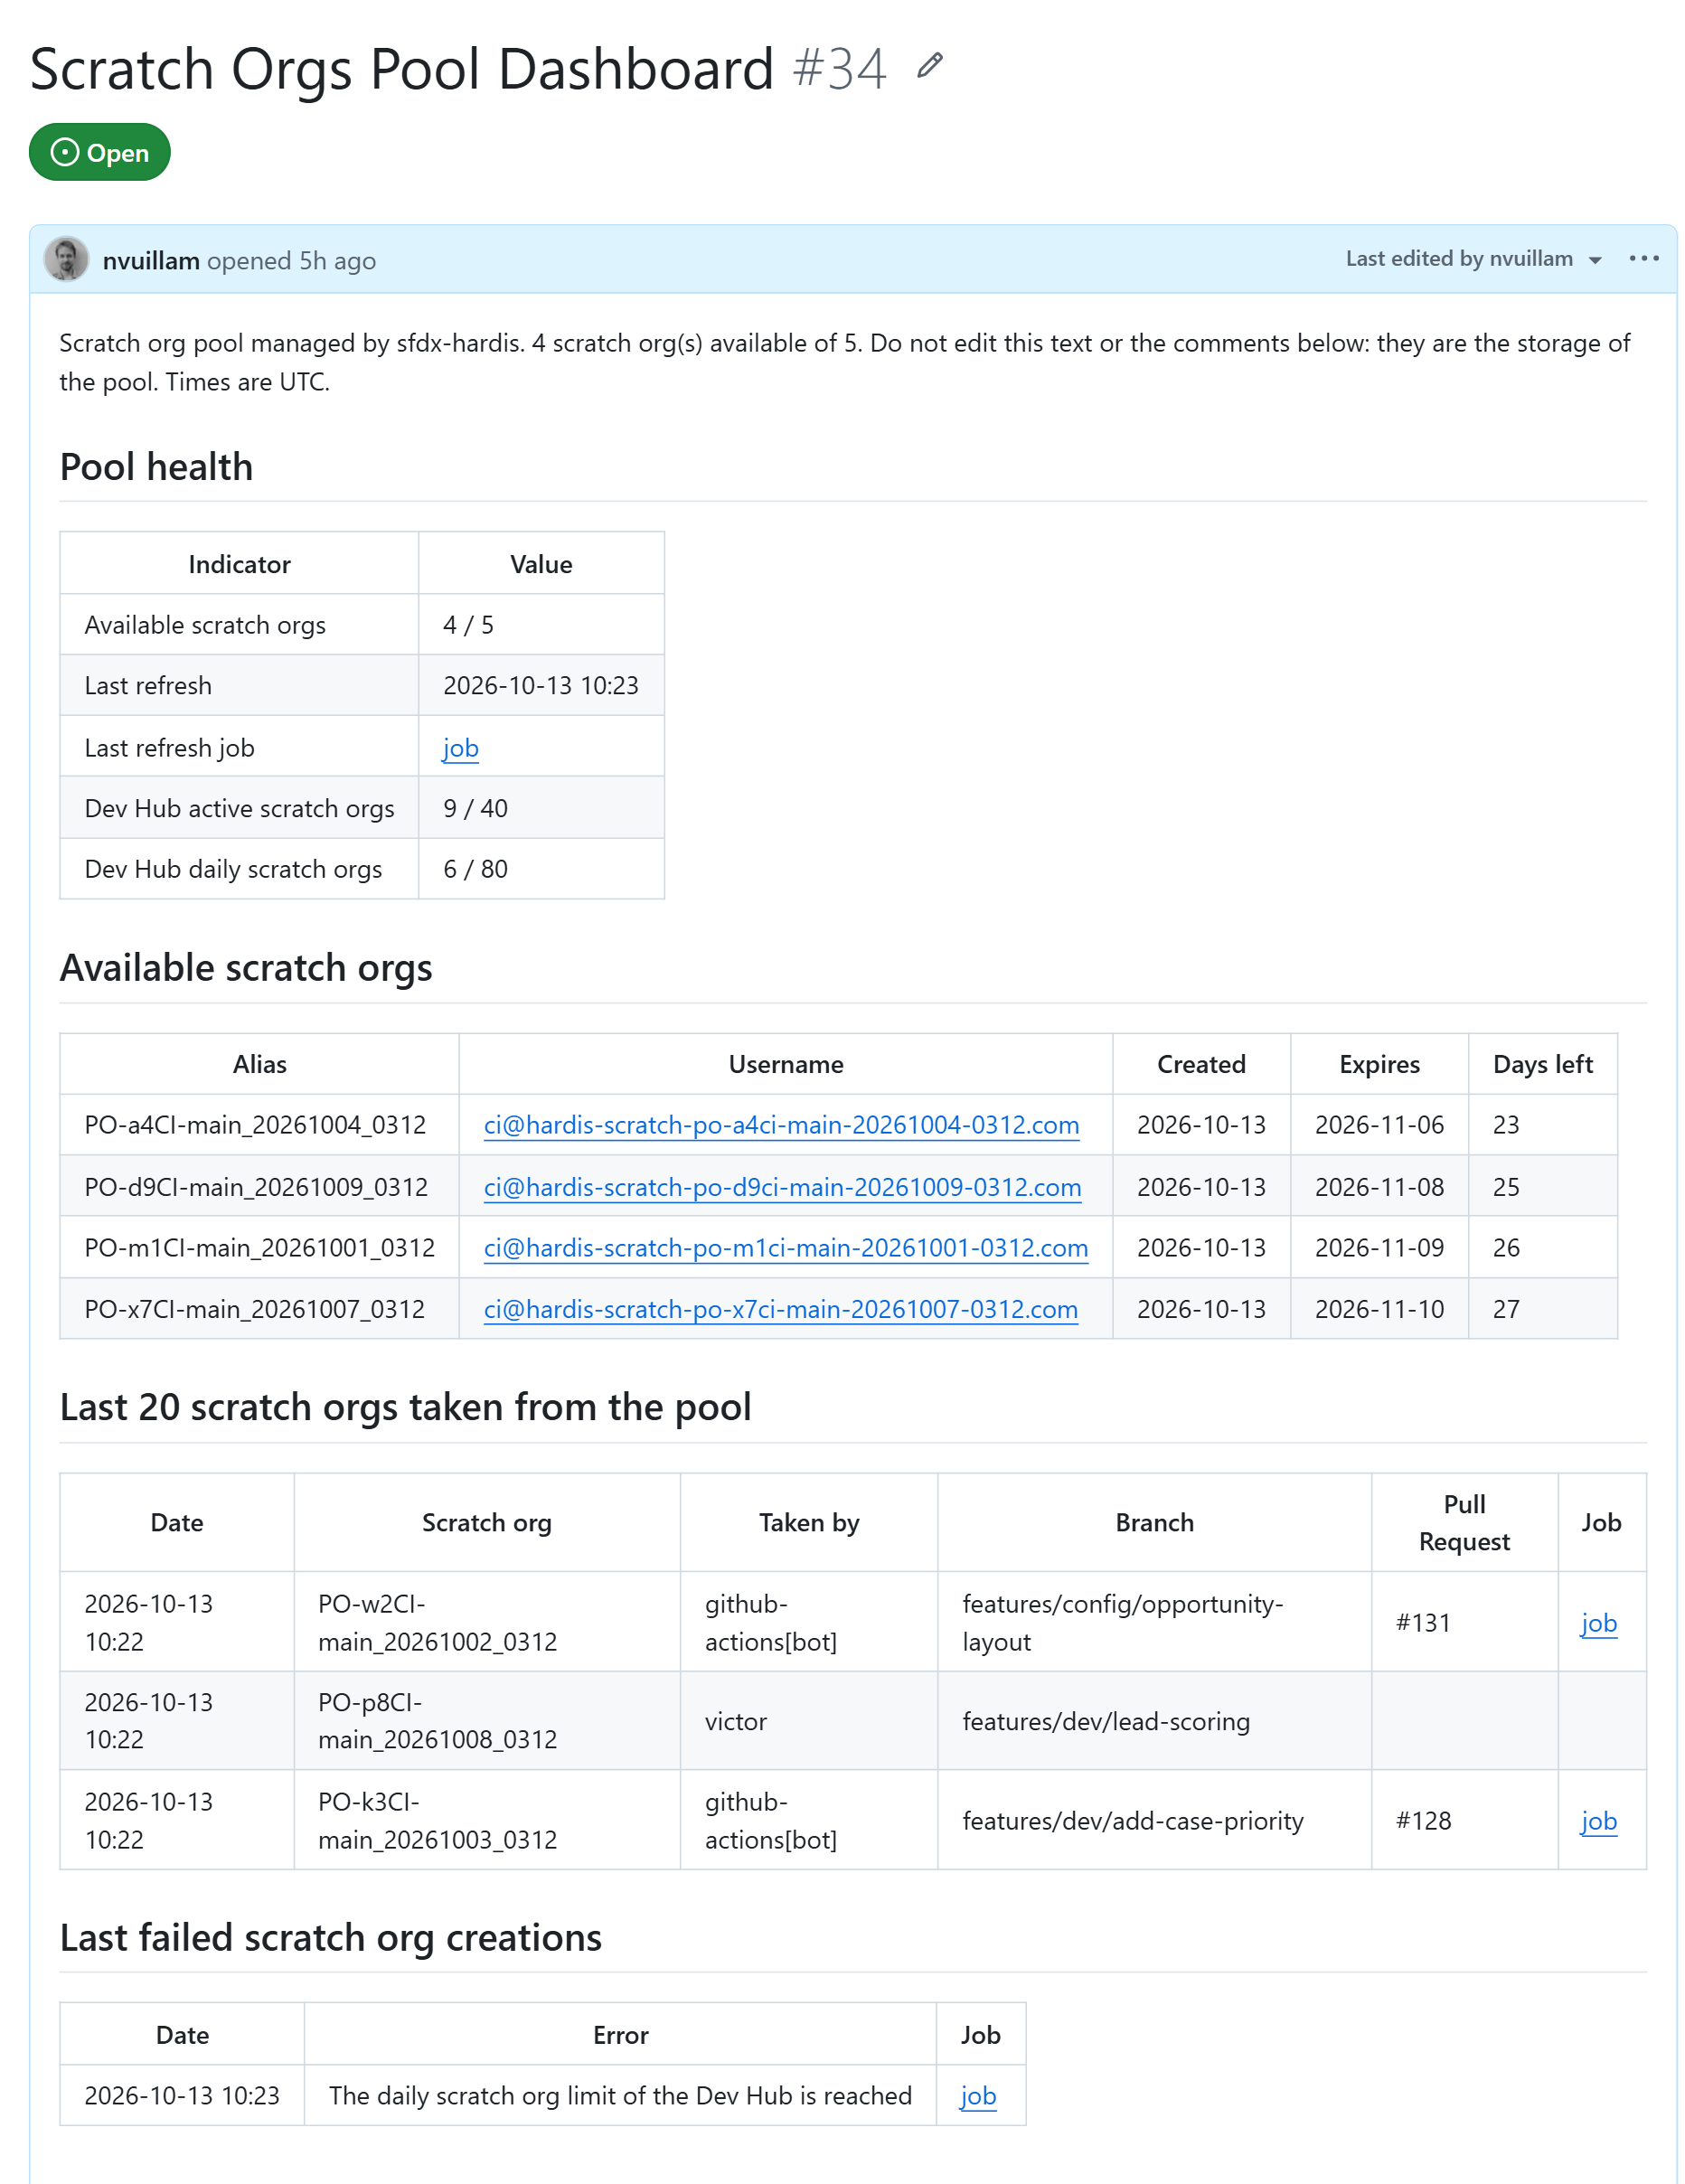
- Nothing to install or pay for: hardis:scratch:pool:create creates the dashboard, and the CI templates already carry the refresh job.
- Credentials are encrypted and signed with a key only your CI variables and your team hold. The dashboard shows what anyone with access to the repository may read: aliases, expiration dates, who took which org for which branch, and the failed creations.
- A VS Code panel, opened from the settings menu of the DevOps Pipeline: take a scratch org, refill or reset the pool, set the encryption key, and see the Dev Hub limits.
- Rotate the key without leaving orphan scratch orgs behind, and a refresh run from a computer never empties a pool it cannot read.
Ships in v8.18.0.
Org initialization (Beta): every new scratch org or sandbox set up the same way
A new scratch org or developer sandbox is empty: it needs the packages, the sources, the permission sets of the team, a few Apex scripts and some test data before anyone can work in it. These used to be scattered settings, run in a fixed order, a little differently for scratch orgs and for sandboxes.
Org initialization gathers them in one ordered list of steps, edited from a new Org Initialization panel, opened from the settings menu of the DevOps Pipeline.
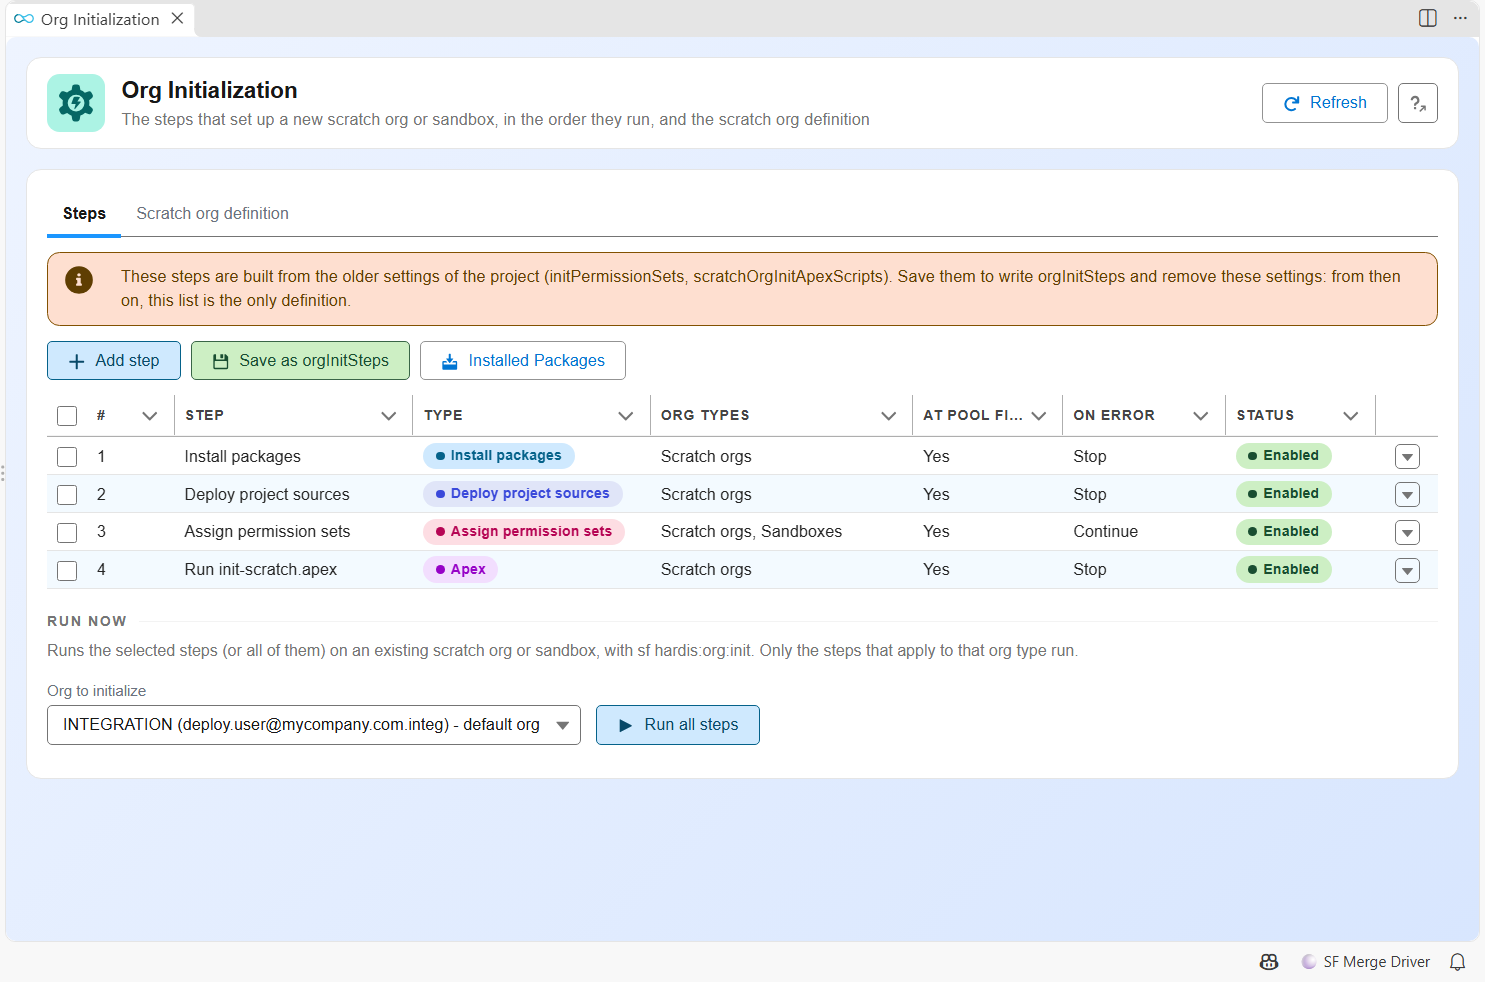
- Every kind of step: install packages, deploy the project sources, assign permission sets, Apex scripts, SFDMU data, commands, batch runs and schedules, publish an Experience site, and your own custom functions.
- Each step decides whether it runs on scratch orgs, sandboxes or both, whether a failure stops the initialization, and whether it runs when the pool is filled. Switch a step off without deleting it.
- A scratch org taken from the pool is ready: every step runs when the pool is filled, and its source tracking starts clean, so your first pull only lists your own changes.
- Run the steps again on any scratch org or sandbox with Run now in the panel, or hardis:org:init. Production orgs are refused.
- The scratch org definition has its own tab: a form for the common fields, a JSON editor for the settings, and a check against the Salesforce CLI schema before anything is saved. hardis:scratch:create runs the same check, and checks the steps, before it requests an org.
- Existing projects keep working: without the new list, the steps are built from your current settings, in the order they always ran. The panel converts them on the first save.
Ships in v8.19.0.
Replacement rules (Beta): the right values in every org
A Named Credential endpoint, the sender of an email alert or the admin of an Experience site is not the same in UAT and in production. Sources retrieved from a sandbox already on the next Salesforce release hold XML elements production refuses, and the deployment fails.
Replacement rules change the files right before each deployment, for the org it goes to, then put them back. Git keeps one version of each file.
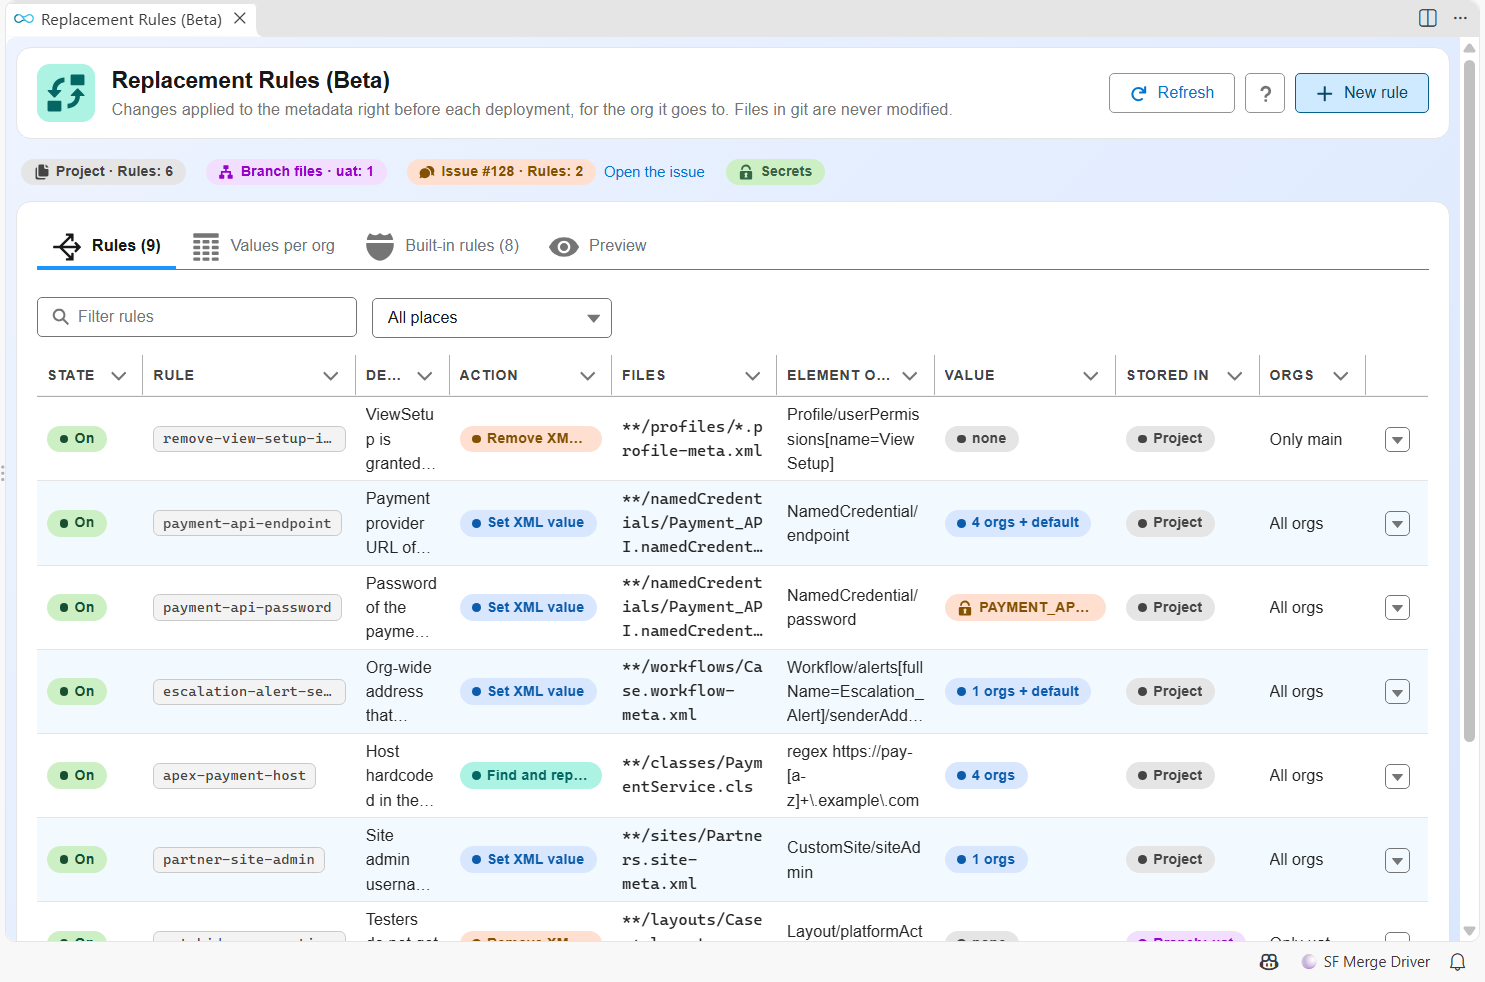
- Set a value per org: the value of each major branch, a
defaultfor developer sandboxes and scratch orgs, or a secret read from a CI/CD variable and masked in every log. - Remove an element: for example one user permission of a Profile with
Profile/userPermissions[name=ViewSetup]. - Find and replace a text or a regular expression in any file: a host hardcoded in Apex, a URL in a Lightning Web Component.
- Built-in rules remove the elements the API version of the target org does not accept yet, like the Flow
endsof Winter '27 when production is still on Summer '26, and the user permissions of Profiles and Permission Sets the target org does not have. See the built-in rules. - Fix a failing deployment without a commit: a release manager can change a rule in the "sfdx-hardis Replacement Rules" issue of the git provider.
- Configured from VS Code with the new Replacement Rules panel, opened from the settings menu of the DevOps Pipeline, or with the hardis:project:replacement commands, also usable by coding agents.
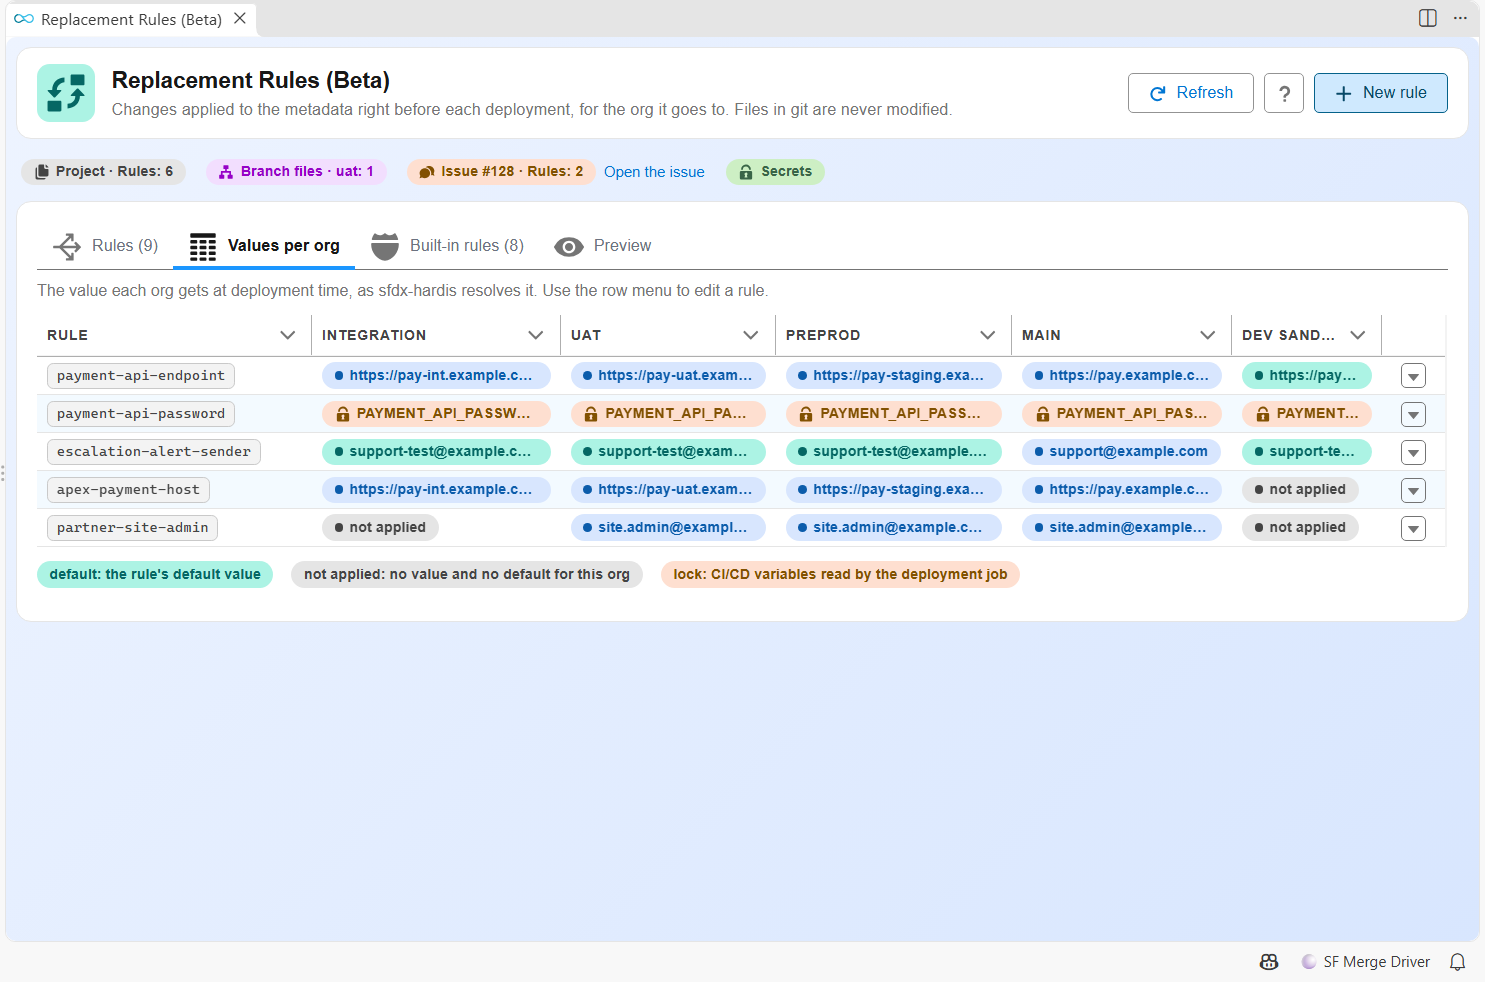
The Pull Request comments list the rules applied to each deployment, and warn when a secret is missing.
Ships in v8.20.0.
Find any Pull Request without leaving VS Code
"Is this story in production yet?" used to mean opening your git provider, finding the Pull Request, then hunting for its comments. The DevOps Pipeline now has a Pull Requests explorer: type a number, a title, a branch, an author or a ticket, and open it in place.
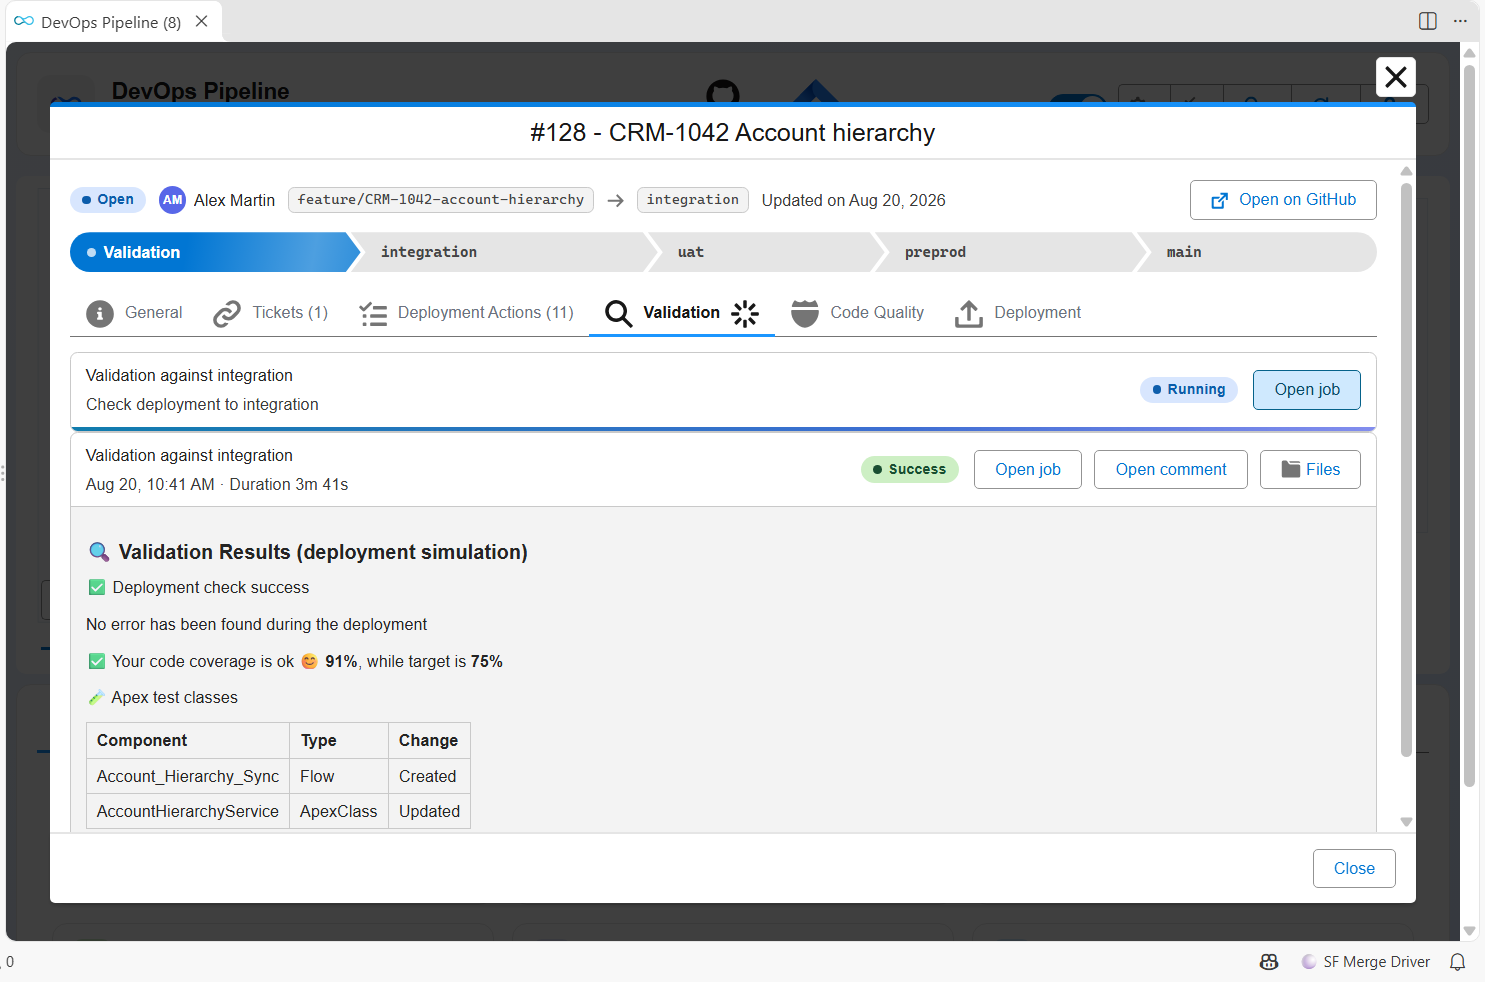
- Where it stands, as a path: the validation, then each major branch up to production, filled once reached.
- Everything about it in tabs: its description, its tickets, its deployment actions and test classes, and the validation, code quality and deployment comments posted on it, as you would read them on your git provider.
- A promotion lists what it carries, and each story names the promotion that carried it: one click goes from one to the other, and Previous brings you back.
- Search goes beyond the pipeline: the Pull Requests already loaded are listed as you type, then your git provider is searched, open and merged alike.
- Pull Request links of the Backpromote panel and of command results open the same window.
Ships in v8.13.0.
Know what uses a component before you change it
Before you change or delete an Apex class, a Flow, a field or a layout, you want to know what uses it. The new Metadata Dependencies panel asks the org and lists every component that uses the one you picked, or every component it uses.
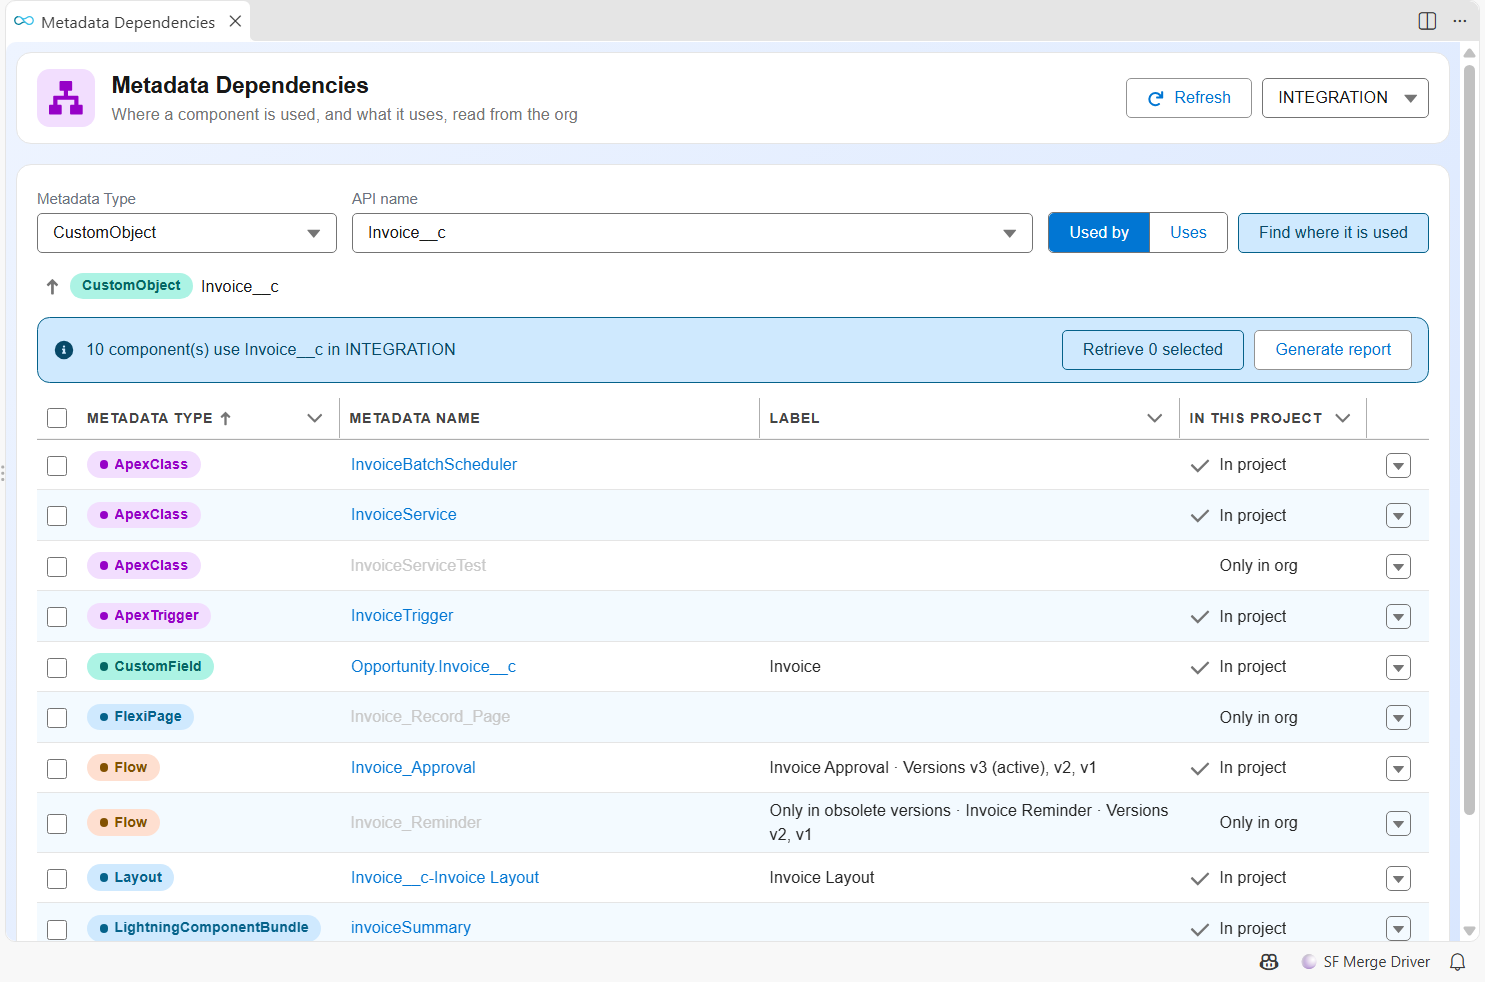
- Right-click a metadata file, or pick Find where it is used in the Metadata Retriever.
- Walk the chain one level at a time, open a dependent, or retrieve it into your project.
- Export the list as a CSV and an Excel file, to share it or attach it to a ticket.
- The panel runs hardis:doc:metadata-deps, which you can also call from a terminal or a pipeline.
Ships in v8.12.0.
Pull Request comments you can read at a glance
sfdx-hardis posts up to three comments on a Pull Request. Until v8 they all looked the same. Now each one opens with a colored banner that says what it is and how it went.
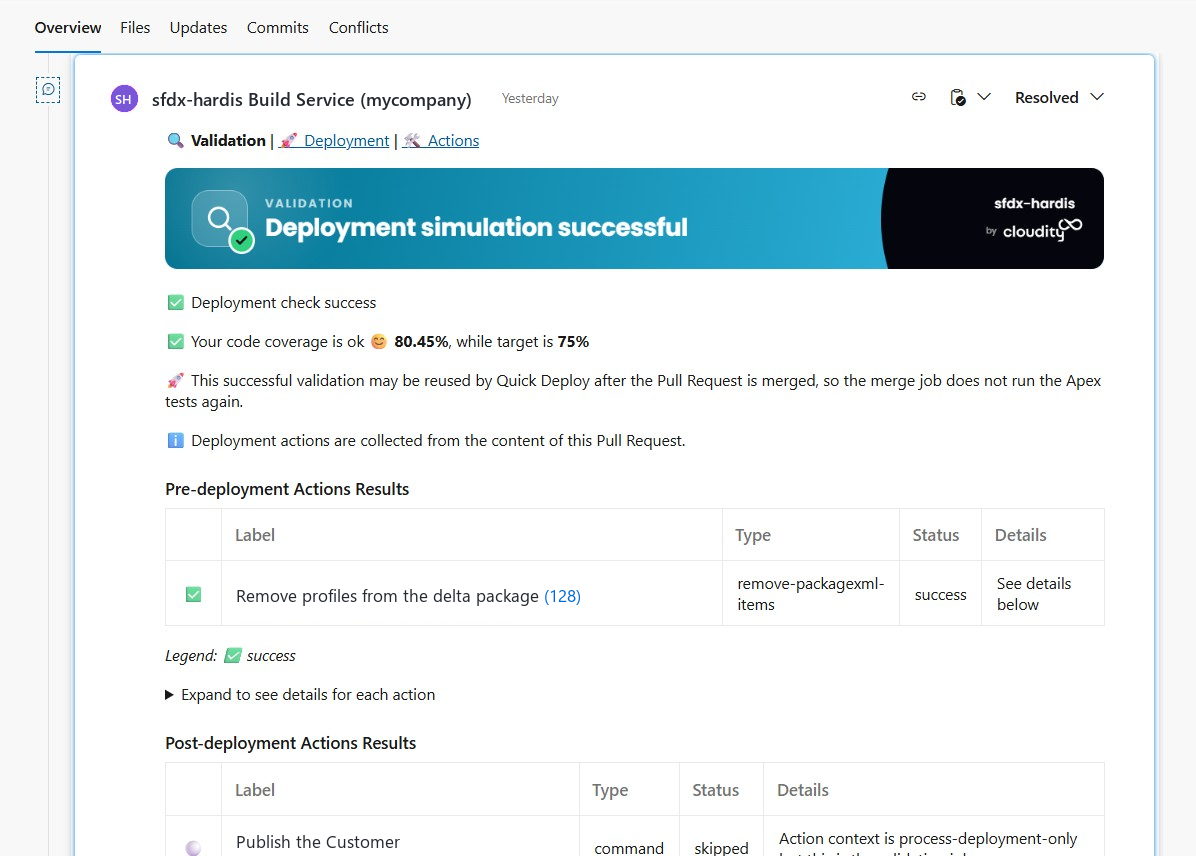
Each comment type has its own color, so you tell them apart while scrolling:
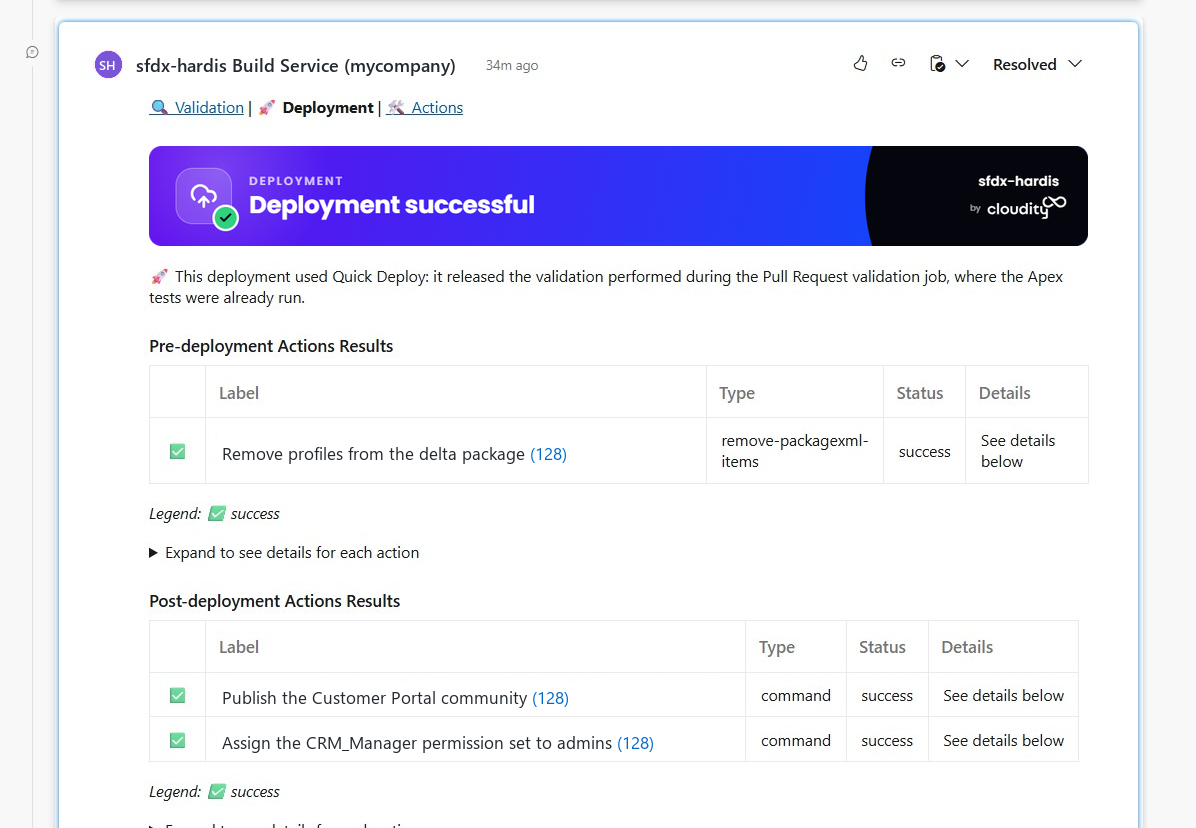
- A navigation line links the three comments together, and is also added at the top of the Pull Request description, so you never scroll to find the right one.
- The check job comment is now called Validation Results (deployment simulation), so it can no longer be mistaken for the real deployment.
- The Deployment Actions comment shows the status matrix, the pending manual actions, a legend and a last-updated date.
- Comments only mention what they contain: no more empty sections, no more legends listing statuses that are not in the table.
- They also explain themselves: which Pull Requests the actions and Apex tests were collected from, and when Quick Deploy applies, so "Apex tests: none run" on a merge job is no longer a surprise.
- The commits summary is collapsed, hides technical merge commits and truncates very long commit bodies.
- The Tickets section warns when JIRA details could not be retrieved, instead of silently showing bare links. All the JIRA credentials you configured are tried until one works, and an authentication failure is now reported in the comments and the release notes instead of passing unnoticed.
- URLs are clickable in every generated XLSX, so a report opened from a comment link takes you straight to the org.
Prefer plain comments? Set SFDX_HARDIS_PR_COMMENT_BANNERS=false, SFDX_HARDIS_PR_COMMENT_NAV=false or SFDX_HARDIS_PR_DESCRIPTION_NAV=false.
Lighter, and safer
Both projects went on a diet, for the same reason: every third-party package is code you have to trust.
| Before (v7.23) | v8 | |
|---|---|---|
| Plugin direct dependencies | 65 | 42 (axios, xml2js, openai, cloudflare, md-to-pdf, fs-extra, inquirer, octokit, farmhash, ora, open, dotenv and others removed) |
| Plugin total packages installed | 1091 | 518 (-53%) |
| Extension direct dependencies | 28 | 14 |
| Extension total packages installed | 327 | 287 |
Widely used but replaceable packages were replaced by capabilities already built into Node.js and VS Code, with no change in behavior. Fewer packages means a smaller supply-chain attack surface, less exposure to a compromised or vulnerable dependency, and a faster install of the plugin, the extension and the Docker images.
A guardrail keeps it that way: the plugin test suite fails when a dependency is declared but never imported, or when the lock file grows past a ceiling.
"No change in behavior" is verified, not assumed. Every Pull Request now replays real commands against a real Salesforce org, on top of the unit tests. sfdx-hardis creates a scratch org with its own hardis:scratch:create, then runs hardis:project:deploy:smart, the data import and export commands and the monitoring diagnostics against it, and checks what the org really holds afterwards. Close to 50 scenarios, replayed on every Pull Request and every night. A regression that only appears against a live org is caught before the release instead of by you.
Personal data no longer leaves your org in clear text
Monitoring jobs produce reports and notifications full of names, emails, user Ids and IP addresses, and they push them to shared destinations: CI artifacts kept for weeks, a Slack channel half the company can read, an observability backend, an email thread. v8 pseudonymizes all of it before it leaves the machine.

It applies to everything a job sends out: the report files attached to emails and published as CI artifacts, the Grafana payloads, and the Email, Slack, Microsoft Teams and Google Chat messages. Previously only the API endpoint was covered.
Pick the level from the Security & Privacy tab of the Pipeline Settings, or the Data anonymization card of the Monitoring Config Workbench. Each one tells you exactly what it masks:
| Level | What it replaces |
|---|---|
| Off | Nothing |
| Standard (default in CI) | Names, emails, user Ids, IP addresses and hostnames |
| Strict | Standard, plus who created, modified, deployed or triggered anything |
Your dashboards keep working. The same person always gets the same pseudonym, so distinct-user counts stay right, Grafana drill-downs still group, and a name you see on a dashboard matches the same name in the XLSX report of that run.
Reports you generate on your own machine are not anonymized, because they have to stay readable for you.
Technical details
- Standard replaces usernames, emails, first, last and display names, Salesforce user record Ids, client IPs and resolved hostnames with
user_<hash>,id_<hash>andip_<hash>. Strict adds the technical actor fields:CreatedBy,LastModifiedBy,DelegateUser,DeployedByandTriggeredBy. - Pseudonyms are salted per org, so they are stable across runs of the same org and cannot be matched across orgs.
- Beyond report files, notifications and API payloads, the files feeding the AI executive summary and the PPTX monitoring report are covered, as well as the tables printed in the CI job logs.
- Levels can be raised for a single channel (report files, API endpoint, email, messaging) when one destination must be stricter than the others.
SFDX_HARDIS_ANONYMIZE=off|standard|strictoverrides everything, and theenforceLocallyproperty applies the configured level to local runs too.
The new Security & Privacy page gathers the whole picture: no sfdx-hardis servers, no telemetry, where your data can go for each integration, and the anonymization reference.
Watch what your org consumes, and what it costs
Salesforce bills more and more on usage. Three new monitoring commands make that visible before the invoice does.
| Command | What it reports |
|---|---|
| Usage-based entitlements | Einstein Requests, Flex Credits, Data 360 credits, API calls, and a warning when consumption is on track to exceed the allowance before the billing period ends |
| Consumption alerts | The consumption and license utilization alerts Salesforce raises on the org |
| Agentforce and Data 360 credits | Credit consumption broken down by agent and by action (requires Data 360) |
Declare your contracted rates in usageCost, and the reports show money next to the percentages, in your own currency.
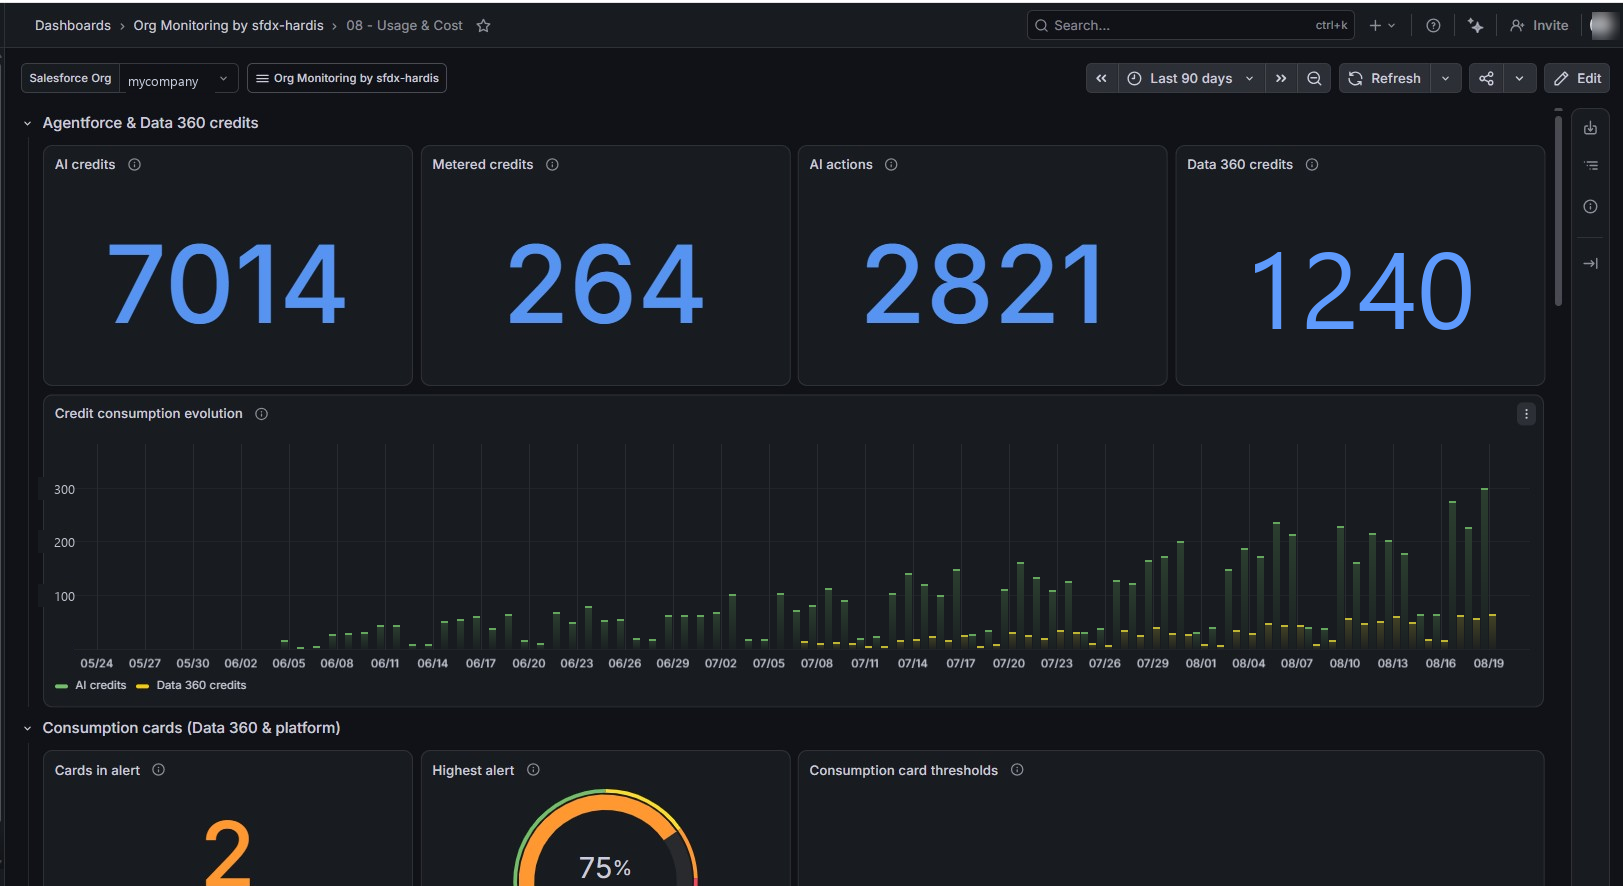
A new "08 - Usage & Cost" dashboard joins the Grafana v2 set for entitlement consumption, projected overage, utilization alerts and AI credits. The "05 - Security Posture" dashboard gets a new MFA readiness section listing the privileged users who are not passkey-ready yet.
Two MFA fixes matter here: privileged users whose permissions come from a Permission Set Group were missed by the report, and an org where neither built-in authenticators nor security keys are enabled now raises an error, because no user can register the method Salesforce requires.
A monitoring run that skips most of its commands used to look exactly like a broken one. It now opens by stating whether frequency gating is active or was forced, and its summary keeps a row for every configured command, including the ones skipped by their frequency and the ones disabled in your configuration.
Ask a coding agent about your org and your pipeline
The monitoring repository holds the daily history of your org. Each backup now writes an AGENTS.md file in it, which tells a coding agent (Claude Code, Codex, Gemini, Copilot...) how the monitoring works, what each folder holds and which checks run. Open the repository with your agent and ask:
- "Which Flows changed last week?"
- "Is the field
Invoice__c.Status__cthe same in production and in the UAT sandbox?" - "Was this change deployed by the pipeline, or made directly in production?"
- "On which days did Apex errors spike this quarter?"
Declare your CI/CD repository as deploymentRepository and the agent reads the pipeline too: its branches, its deployment actions, its Pull Requests and its job logs. Add grafanaUrl and it queries months of monitoring logs and metrics. It only reads: no push, no comment, no pipeline run.
Ships in v8.11.0.
Sandbox refresh, covered end to end
Refreshing a sandbox destroys more than metadata. v8 closes the gaps that used to end in a manual checklist.
- Connected Apps: Salesforce no longer lets you restore them after a refresh.
before-refreshnow lists the ones not yet converted to External Client Apps and pauses, so you can convert them while it still matters. - External OAuth apps (OwnBackup and other tools connected with "Log in with Salesforce") cannot be saved at all. The command no longer fails on them: it captures what will need re-authentication and
after-refreshdisplays it as a manual actions checklist. - Scheduled Apex: one Apex script is generated per user, to reschedule their jobs with their original owner using "Login As" and Execute Anonymous.
- Several sandboxes in parallel: selections and reports are kept separate for each sandbox, so preparing one refresh no longer overwrites the choices of another.
- A failed restore is resumable:
after-refreshdetects the steps already done and asks before redoing them, and lists the components the org rejected with their error so you can fix the manifest and run it again.
See the Sandbox Refresh guide.
Deleting a Flow is now part of the deployment
Removing a Flow used to be a manual step in every org, because a Flow deletion can neither be validated by a --check deployment nor survive a Quick Deploy.
In v8, a Flow listed in your destructive changes is deactivated then deleted through the Tooling API, version by version, and the validation job reports the deletion plan in the Pull Request comment.
- The
--checkjob fails early if Flow Interviews block a deletion, instead of failing at deployment time. - Set the
FLOW_DELETE_INTERVIEWSkeyword on the Pull Request (orflowDeleteInterviewsin your configuration) to authorize deleting the blocking Flow Interviews.
Caution: deleting Flow Interviews is irreversible and destroys in-flight process state. - The extension exposes the matching settings, including Flow Delete Interviews in the Danger Zone.
Two related fixes: Reports and Dashboards are no longer overwritten when the target org holds them in a different folder than your sources (their API name is unique org-wide), and the deployment warns when a package lists the same Report or Dashboard API name under several folders.
Pipelines run in the sfdx-hardis Docker image
The default GitHub Actions, Azure Pipelines and Bitbucket Pipelines workflows now run in the sfdx-hardis Docker image, like GitLab always did.
- Jobs no longer install Node.js, the Salesforce CLI and its plugins at every run: they start faster and can no longer be broken by a bad release of a dependency.
- To let the pipeline auto-fix deployment errors with coding agents, switch to the
ghcr.io/hardisgroupcom/sfdx-hardis-ubuntu-with-agents:latestimage. - Images are published to GitHub Container Registry (
ghcr.io/hardisgroupcom/sfdx-hardis), the recommended default, and mirrored on Docker Hub. - Existing pipelines keep working: the templates apply when you initialize a new project or monitoring repository.
Two new pages help you check your setup: the CI/CD Setup Checklist and how to publish job artifacts on any platform.
Learn it hands-on: free training with badges
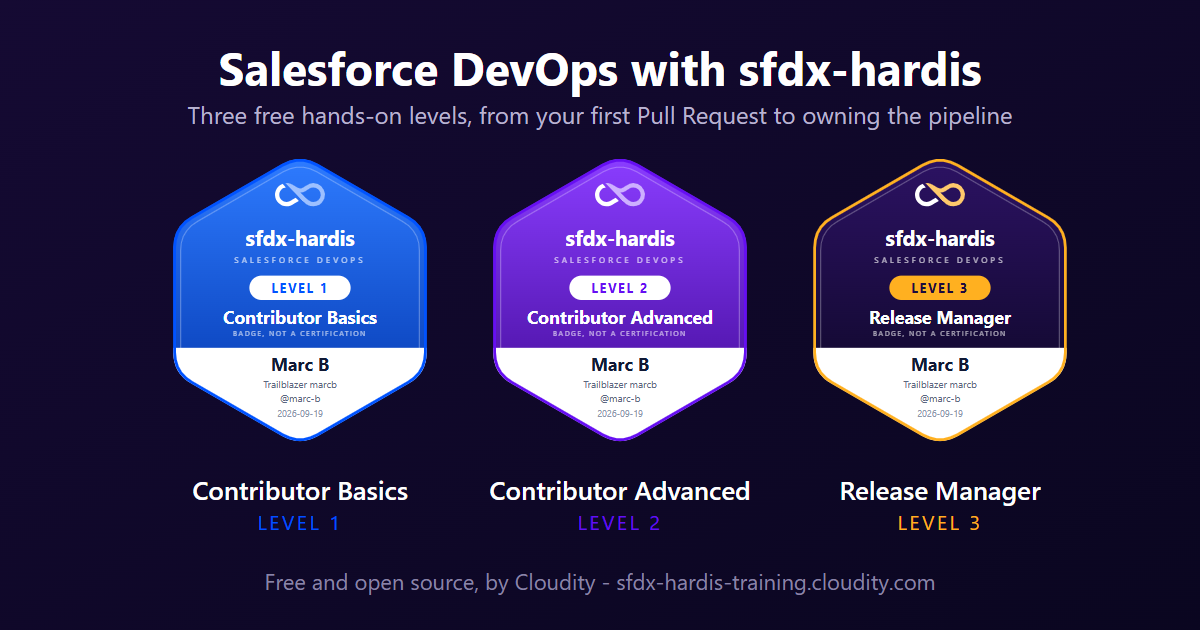
Salesforce DevOps with sfdx-hardis is a free course that builds a complete CI/CD pipeline on free orgs, one click at a time in VS Code, with screenshots of the real panels.
- Three levels: Contributor basics, Contributor advanced and Release Manager, from your first User Story to owning the pipeline.
- A badge per level, on a page you can share on LinkedIn. To award it, a job re-runs every check of the level against your public repository.
- Nothing to pay: a free GitHub account and free Developer Edition orgs are all it takes.
- Available in English and French.
Before you upgrade
A few behaviors changed on purpose. Check these if they apply to your project.
| Change | What to do |
|---|---|
Post-deployment actions no longer run when the deployment failed. The skipIfError property is removed and ignored. |
If an action relied on skipIfError: false to run after a failed deployment, move it elsewhere. |
packageXmlToDeploy, packageXmlToDelete and packageXmlToDeletePreDeploy are no longer ignored. A bug made the default manifest/ and config/ paths always win, so a custom destructive manifest could delete nothing and still exit with success. |
If you set one of these properties, review what your next deployment will actually deploy and delete. |
| A Flow in destructive changes is deleted outside the deployment transaction. | A failed deployment leaves the Flow deactivated or deleted instead of rolling it back. Every step is re-runnable, so retrying the pipeline converges. |
--check no longer validates Flow destructive members against the org. |
A Flow missing from the target org is reported as FLOW_DELETE_NOOP and passes, because the same destructive changes are replayed along the promotion chain. |
Reports, notifications and CI logs produced in CI are anonymized at the standard level by default. |
If a downstream tool of yours reads real usernames or emails out of them, set SFDX_HARDIS_ANONYMIZE=off, or lower the level of that single channel. |
| Connected Apps can no longer be restored after a sandbox refresh. | Convert them to External Client Apps before your next refresh. |
hardis:work:refresh is replaced by backpromote, and New User Story no longer deploys metadata to an existing sandbox. |
Use the Backpromote panel, or sf hardis:work:backpromote, to bring a sandbox up to date with its parent branch. |
| The plugin requires Node.js 22 or more, like the Salesforce CLI. | Upgrade Node.js on machines and CI runners that still use Node.js 20. |
How to upgrade
# Plugin
sf plugins install sfdx-hardis
- VS Code extension: VS Code updates it automatically. Check the version on the Welcome page.
- CI/CD pipelines: they use
latestby default. Pin a version if your policy requires it. - Monitoring repositories: no action needed, unless you want the new dashboards. Run hardis:org:configure:grafana-dashboards to get the Usage & Cost dashboard.
Free, and supported if you want it
sfdx-hardis is open-source and free, with no license fee, no per-contributor pricing and no vendor lock-in. Everything runs on your Git platform, your CI runners and your VS Code. There are no sfdx-hardis servers, and your data never leaves your infrastructure.
Community support is available through GitHub Issues, handled by maintainers and contributors in their available time.
If your team needs more, Cloudity, the company behind sfdx-hardis, offers professional services around it:
- Setup and migration: get your pipeline, your monitoring and your orgs configured by the people who build the tool.
- Support subscription: guaranteed response times, a pool of Salesforce DevOps experts, and proactive alerts on Salesforce changes that affect your pipelines.
- Release Manager as a Service: a Cloudity release manager drives your Pull Requests, deployments and releases, permanently or as holiday cover.
- Training and coaching: bring your admins, developers and release managers up to speed on the v8 workflow.
Subscriptions also fund the development of the open-source project, the new features and the security patches everyone benefits from.
