Metadata Backup
Metadata Backup
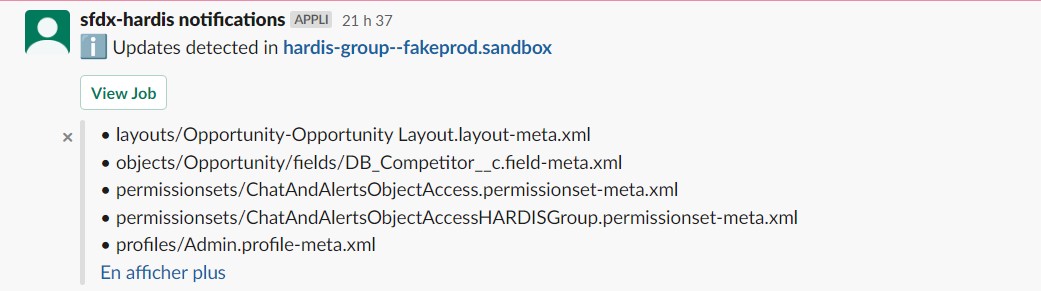
Adds a new commit to the git branch with the changes made since the latest monitoring run.
Sfdx-hardis command: sf hardis:org:monitor:backup
Complete Profiles
A file-based retrieve returns a Profile with only the permissions related to the other components retrieved with it. The backup reads the Profiles again with the CRUD Metadata API, so each file holds everything the Profile grants, as the Auto mode of the VS Code Metadata Retriever does.
- Entries that grant nothing are left out: a permission revoked in the org shows as removed lines in the next backup.
- The first backup that runs with this behavior reports every Profile as updated. It is not a change in your org.
- A Profile that can not be read fails the backup and names the Profile: add it to
manifest/package-skip-items.xmlto leave it out.
Deleted components
When a component is deleted from the org, the next backup deletes its files, so the git history shows the deletion.
- A file is deleted only when its component is no longer in
manifest/package-all-org-items.xml, the list of everything that exists in the org. A component that still exists but that you skip keeps the file of its last backup. - For a metadata type you skip as a whole (
Report,Dashboard...), only the deletions made in the org from now on are mirrored: the files left by older deletions stay. - Before deleting, the backup asks the org for each component with the Metadata API, and keeps the files when the org still returns it or can not be asked about it. The job log lists the deleted files and the ones kept.
- There is no limit: a cleanup that removes a lot of metadata is mirrored by the next backup.
- The first backup that runs with this behavior deletes the files of everything deleted in the org since the monitoring started. It is not a change made in your org that day.
- To keep the files of deleted components, set
monitoringBackupSkipDeletions: truein the.sfdx-hardis.ymlof the monitoring branch, or the variableMONITORING_BACKUP_SKIP_DELETIONS=true.
Ask questions with a coding agent
Each backup also writes an AGENTS.md file at the root of the monitoring repository (and a CLAUDE.md that imports it, when there is none). It tells a coding agent (Claude Code, Codex, Gemini, Copilot...) how the monitoring works, what each file and folder holds, what the backup skips and which monitoring checks run on the branch.
Open the monitoring repository with your coding agent and ask things like:
- "Which Flows changed last week?"
- "When was the Account validation rule
Check_VATlast modified, and what changed?" - "Is the field
Invoice__c.Status__cthe same in production and in the UAT sandbox?"
Only the block between the sfdx-hardis-monitoring-agents-start and sfdx-hardis-monitoring-agents-end markers belongs to sfdx-hardis. Write your own notes after the end marker: the next backups keep them. Keep both markers: when one of them is missing, the backup leaves the file alone and logs a warning.
Search the deployment repository and the pipelines too
Set deploymentRepository in the .sfdx-hardis.yml of the monitoring branch to the address of the sfdx-hardis CI/CD repository that deploys to the org. Configure Org Monitoring asks for it, and suggests the value already set on another monitoring branch. It is the mirror of monitoringRepository in the CI/CD repository. When it is missing, the coding agent offers to set it the first time a question needs it.
To set it, change it or remove it later, edit deploymentRepository in the .sfdx-hardis.yml of the monitoring branch, or use Set deployment repository in the Org Monitoring panel of VS Code. Commit and push .sfdx-hardis.yml afterwards.
AGENTS.md then tells the agent to:
- clone the deployment repository next to the monitoring one (or use the clone already there), read-only
- find the branch that deploys to the org, from the
instanceUrlof itsconfig/branches/.sfdx-hardis.<branch>.yml, or from the optionaldeploymentBranchproperty - understand how the pipeline is built and what it deploys:
mergeTargets, delta deployments, overwrite management, deployment actions of the branches and of each Pull Request - read the pipeline logs and the Pull Requests of both repositories with
gh,glab,azor the Bitbucket API
It can then answer questions like "Was this change deployed by the pipeline, or made directly in production?" or "Why did last night's backup fail?".
The agent uses the git provider CLI you are already logged in with, or tokens in a .env file at the root of the monitoring repository, with the variable names sfdx-hardis uses (CI_SFDX_HARDIS_GITHUB_TOKEN, CI_SFDX_HARDIS_GITLAB_TOKEN, CI_SFDX_HARDIS_AZURE_TOKEN, CI_SFDX_HARDIS_BITBUCKET_TOKEN). It only reads: no push, no comment, no pipeline run. It answers without connecting to your Salesforce org; when a question needs live org data, it asks you first, uses an org you authenticated (for example from the Org Manager of VS Code), runs read-only queries only, and never writes to the org.
Query the monitoring history in Grafana
When the monitoring sends its notifications to Grafana (NOTIF_API_URL and NOTIF_API_METRICS_URL), the agent can also query the logs and metrics of every check, over months: "How did the API requests limit evolve this quarter?", "On which days did Apex errors spike?".
- Put the URL of the Grafana instance as
grafanaUrlin the.sfdx-hardis.ymlof the monitoring branch, or in theGRAFANA_API_URLenvironment variable. When it is missing, the agent offers to set it. - Optional: pin the datasources with
grafanaLokiDatasourceUidandgrafanaPrometheusDatasourceUid. Otherwise the agent detects them. - Give the agent a Grafana service account token with the Viewer role, as
GRAFANA_API_TOKENin the.envfile. Never put the token in.sfdx-hardis.yml. If your instance restricts data source permissions, also give that service account the Query permission on the Loki and Prometheus data sources.
The agent queries Loki and Prometheus through the Grafana API, and only reads: it never changes a dashboard, an alert or a datasource. How far back it can answer depends on your Grafana plan: the Grafana Cloud free tier keeps logs and metrics about 14 days, paid plans usually keep the logs (the detail of each report) about 30 days and the metrics about 13 months.
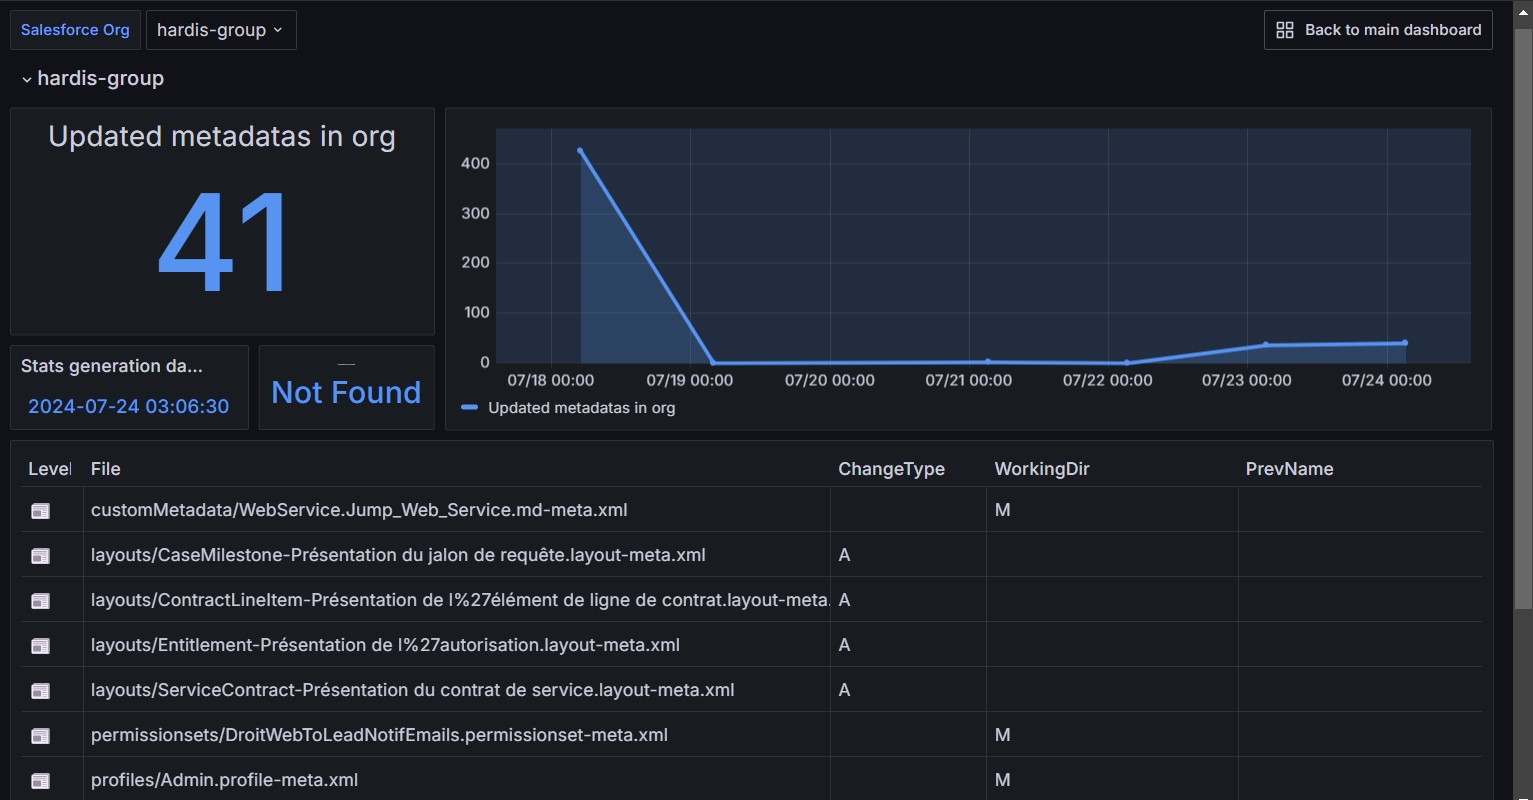
Grafana example
Slack example