Grafana
API Integration
You can send notifications to an external API endpoints, for example to build Grafana dashboards
- Deployment from a major branch to a major Salesforce org (ex: integration git branch to Integration Org)
- Salesforce Org Monitoring
- Latest updates
- Failing apex tests
- Monitoring checks notifications
Logs Configuration
Define the following CI/CD variables:
- NOTIF_API_URL : API endpoint
- NOTIF_API_BASIC_AUTH_USERNAME : Basic auth username (if using Basic Auth)
- NOTIF_API_BASIC_AUTH_PASSWORD : Basic auth password/token (if using Basic Auth)
- NOTIF_API_BEARER_TOKEN : Bearer token (if using bearer auth)
Examples of configuration:
NOTIF_API_URL=https://logs-prod-012.grafana.net/loki/api/v1/push
NOTIF_API_BASIC_AUTH_USERNAME=3435645645
NOTIF_API_BASIC_AUTH_PASSWORD=GHTRGDHDHdhghg23345DFG^sfg!ss
NOTIF_API_URL=https://my.custom.endpoint.net
NOTIF_API_BEARER_TOKEN=DDHGHfgfgjfhQESRDTHFKGKHFswgFHDHGDH
Example of logs sent to Loki:
{
  "streams": [
    {
      "stream": {
        "source": "sfdx-hardis",
        "type": "LINT_ACCESS",
        "orgIdentifier": "hardis-group",
        "gitIdentifier": "monitoring-hardis-org/monitoring_hardis_group",
        "severity": "warning"
      },
      "values": [
        [
          "1715530820301000000",
          "{\"metric\":3,\"_dateTime\":\"2024-05-12T16:20:20.301Z\",\"_severityIcon\":\"⚠️\",\"_title\":\"⚠️ 3 custom elements have no access defined in any Profile or Permission set in monitoringhardisgroup\",\"_logBodyText\":\"⚠️ 3 custom elements have no access defined in any Profile or Permission set in monitoringhardisgroup\\n\\nfield\\n\\n• Activity.DBActivityType__c\\n\\n• Activity.IdExterneCARRENET__c\\n\\n• Activity.Typederendezvous_c\\n\\nLinks:\\n\\n  View Job: https://gitlab.onpremise.com/busalesforce/hardis-group-interne/monitoring-hardis-org/-/jobs/12345\\n\\nPowered by sfdx-hardis: https://sfdx-hardis.cloudity.com\",\"_logElements\":[{\"type\":\"field\",\"element\":\"Activity.DB_Activity_Type__c\",\"severity\":\"warning\",\"severityIcon\":\"⚠️\"},{\"type\":\"field\",\"element\":\"Activity.IdExterneCARRENET__c\",\"severity\":\"warning\",\"severityIcon\":\"⚠️\"},{\"type\":\"field\",\"element\":\"Activity.Type_de_rendez_vous__c\",\"severity\":\"warning\",\"severityIcon\":\"⚠️\"}],\"_metrics\":{\"ElementsWithNoProfileOrPermissionSetAccess\":3},\"_metricsKeys\":[\"ElementsWithNoProfileOrPermissionSetAccess\"],\"_jobUrl\":\"https://gitlab.onpremise.com/busalesforce/hardis-group-interne/monitoring-hardis-org/-/jobs/399629\"}"
        ]
      ]
    }
  ]
}
Metrics Configuration
Additionally, you can send metrics in Prometheus format to a secondary API endpoint.
The configuration is the same than for logs, but with different variable names.
- NOTIF_API_METRICS_URL
- NOTIF_API_METRICS_BASIC_AUTH_USERNAME
- NOTIF_API_METRICS_BASIC_AUTH_PASSWORD
- NOTIF_API_METRICS_BEARER_TOKEN
Example of configuration:
NOTIF_API_METRICS_URL=https://influx-prod-72-prod-eu-west-2.grafana.net/api/v1/push/influx/write
NOTIF_API_METRICS_BASIC_AUTH_USERNAME=345673
NOTIF_API_METRICS_BASIC_AUTH_PASSWORD=GHTRGDHDHdhghg23345DFG^sfg!ss
Example of metrics sent to Prometheus
ApexTestsFailingClasses,source=sfdx-hardis,type=APEX_TESTS,orgIdentifier=hardis-group,gitIdentifier=monitoring-hardis-org/monitoring_hardis_group metric=0.00
ApexTestsCodeCoverage,source=sfdx-hardis,type=APEX_TESTS,orgIdentifier=hardis-group,gitIdentifier=monitoring-hardis-org/monitoring_hardis_group metric=90.00
Per notification type severity threshold
The API channel (Grafana Loki / Prometheus / custom endpoint) is configurable per notification type, exactly like messaging and email. By default it forwards everything (so Grafana dashboards stay complete), but you can raise the threshold or mute a notification type entirely from .sfdx-hardis.yml:
monitoringCommands:
  - key: AUDIT_TRAIL
    notifications:
      api: log             # everything reaches Grafana (default)
  - key: METADATA_STATUS
    notifications:
      api: warning         # only warning / error / critical reach Grafana
  - key: ORG_LIMITS
    notifications:
      api: off             # disable API/Grafana for this type
See Monitoring configuration for the full per-channel routing model.
Skip Configuration
The API channel is always sent by default when
NOTIF_API_URLis configured, regardless of the per-channel severity threshold. To filter what reaches the API per notification type, use either the env vars below, or setapi: off(or any other threshold) in the per-entrynotificationsblock ofmonitoringCommands-- see Monitoring configuration.
You can skip sending logs or metrics to the API based on notification type by defining the following CI/CD variables:
- NOTIF_API_SKIP_LOGS : Comma-separated list of notification types to skip for logs, or
allto skip all logs - NOTIF_API_SKIP_METRICS : Comma-separated list of notification types to skip for metrics, or
allto skip all metrics
Examples of configuration:
NOTIF_API_SKIP_LOGS=all
NOTIF_API_SKIP_METRICS=APEX_TESTS,DEPLOYMENT
Troubleshooting
If you want to see the content of the API notifications in execution logs, you can define NOTIF_API_DEBUG=true
Grafana Setup
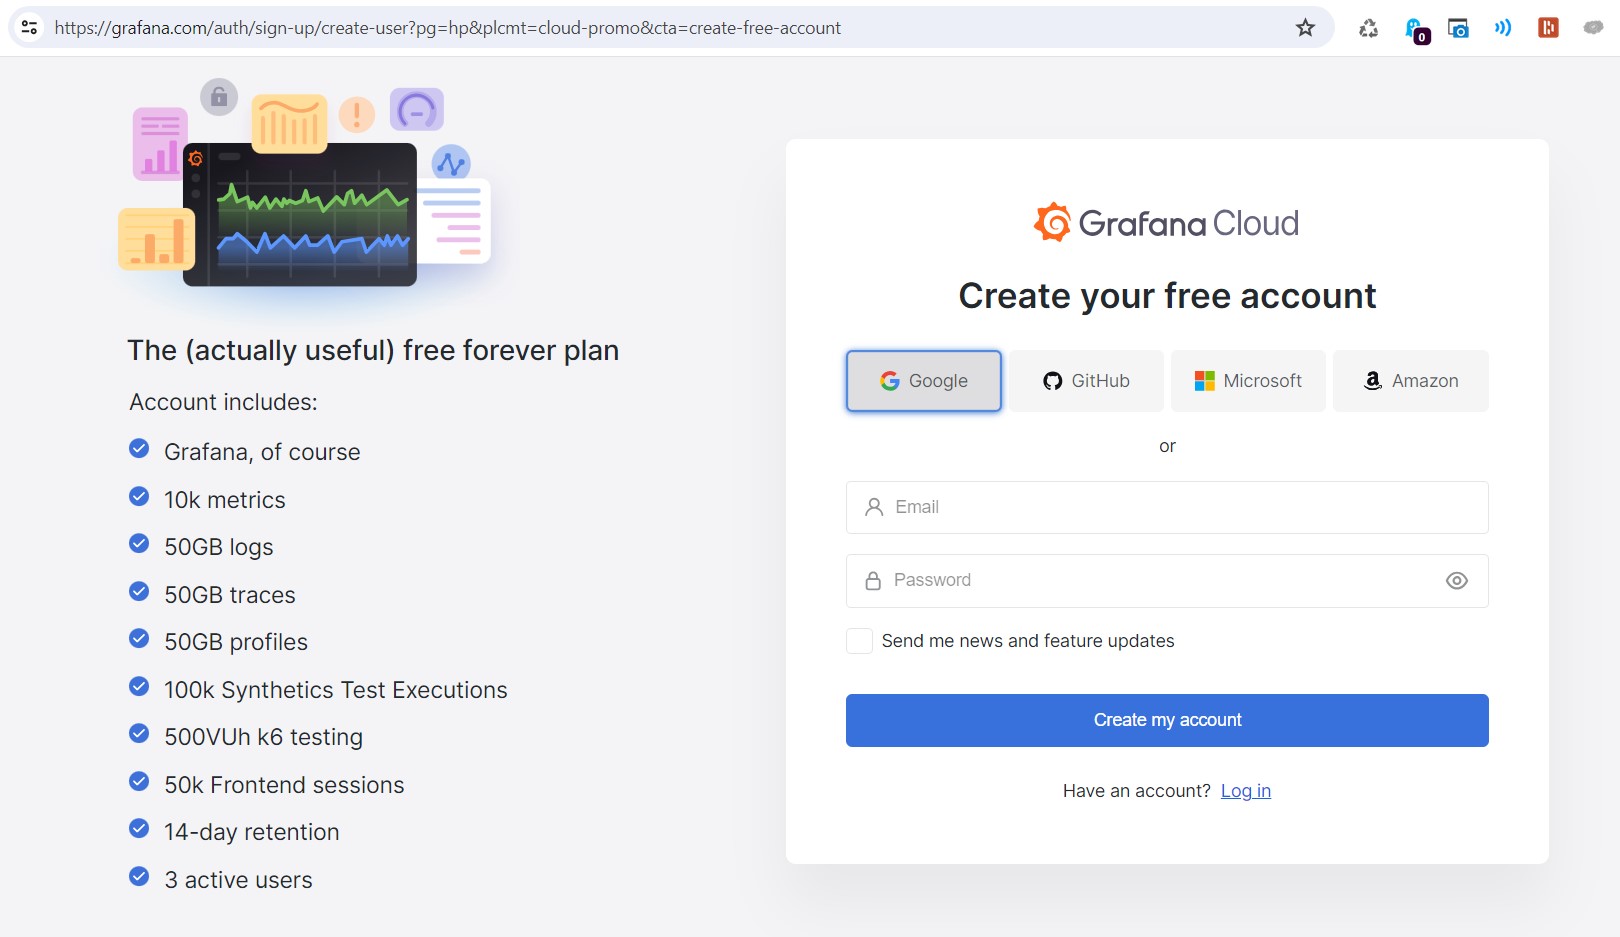
If you don't have a Grafana server, you can use Grafana Cloud Free Tier (14 days of logs & metrics retention + 3 users, no credit card required, free forever)
If you do have a Grafana server and want to use a log aggregation tool like vector to ingest logs, there is a setup doc Salesforce Monitoring Setup with Vector/Datadog and PushGateways
Create Grafana Account
Create a Grafana Cloud Free account at this url
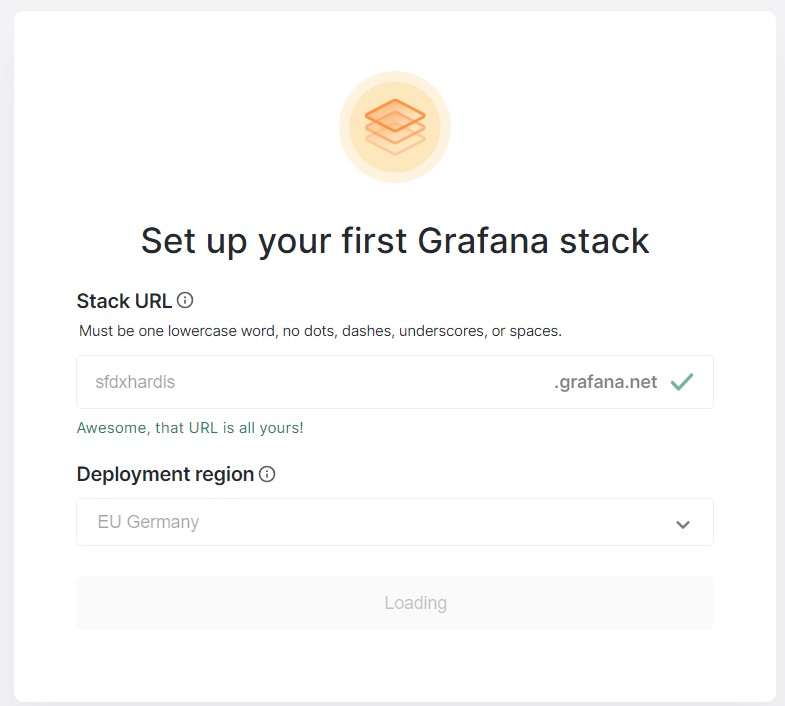
Input a Grafana Cloud org name (sfdxhardis in the example)
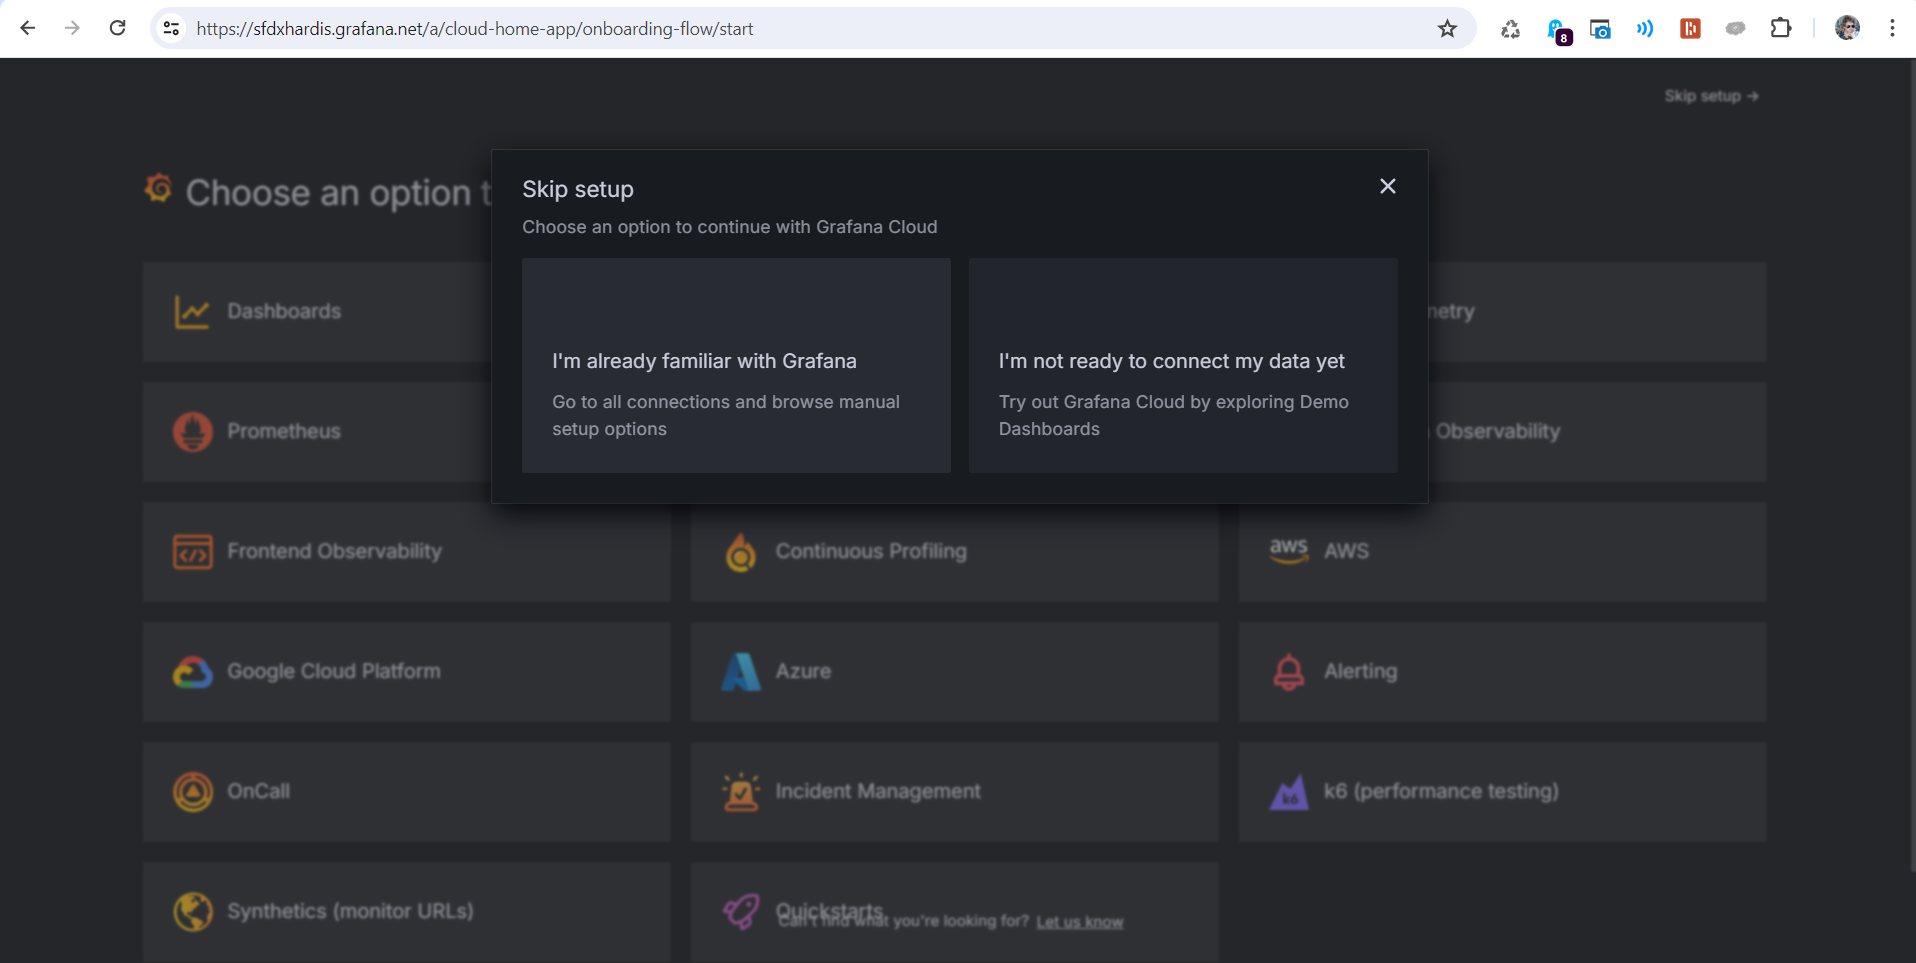
Next screen, you can skip setup
Gather URLs & auth info
Create a notepad when you copy paste the following text
NOTIF_API_URL=
NOTIF_API_BASIC_AUTH_USERNAME=
NOTIF_API_BASIC_AUTH_PASSWORD=
NOTIF_API_METRICS_URL=
NOTIF_API_METRICS_BASIC_AUTH_USERNAME=
NOTIF_API_METRICS_BASIC_AUTH_PASSWORD=
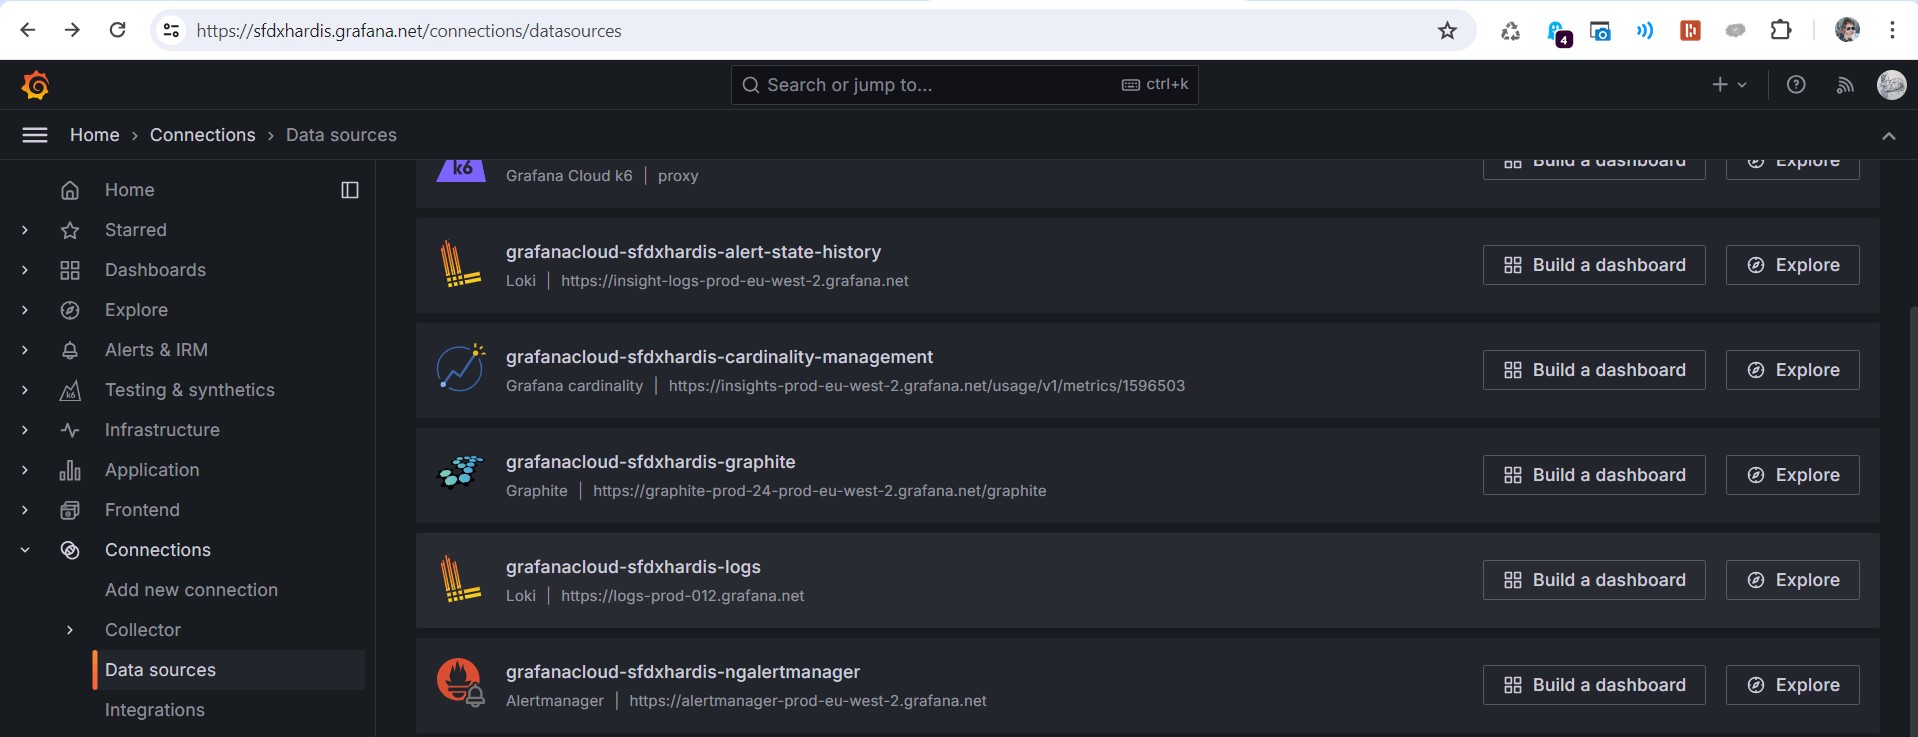
Get Loki configuration
Go to Connections -> Data Sources and click on grafanacloud-YOURORGNAME-logs (Loki)
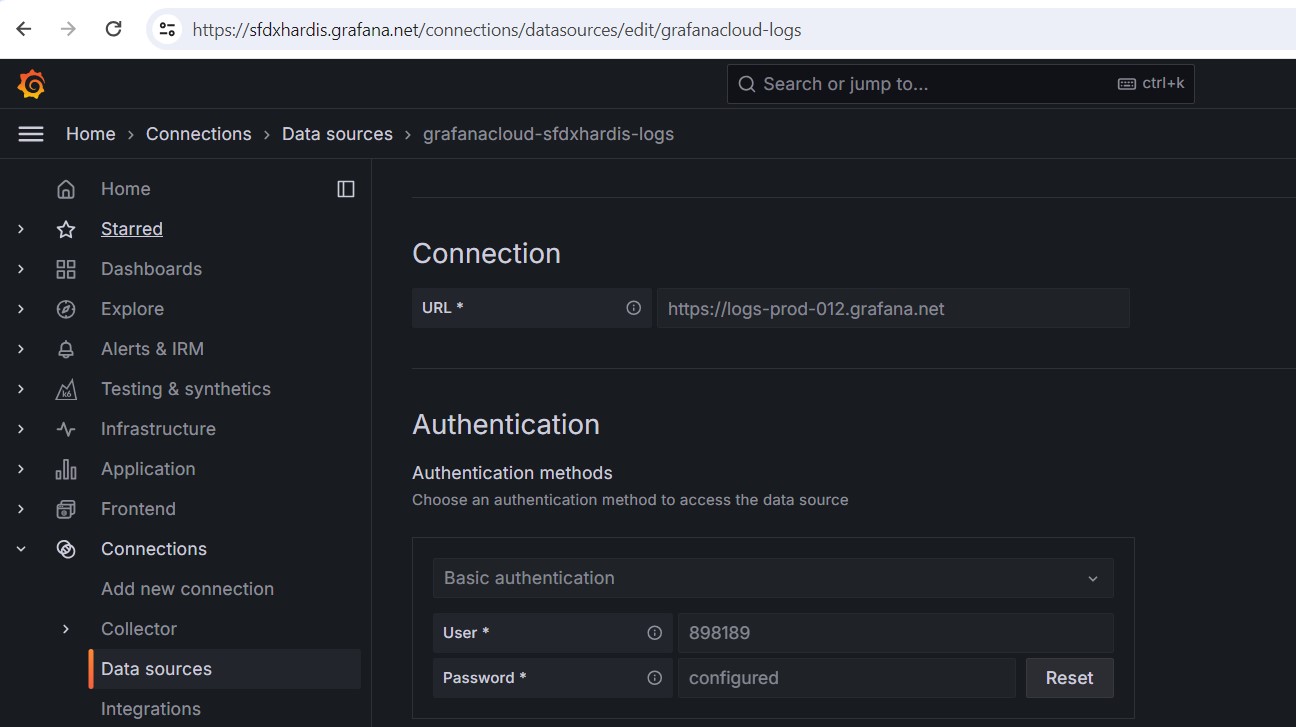
Build Logs push url
- Copy value of Connection URL (something like
https://logs-prod-012.grafana.net/) - Add
/loki/api/v1/pushat the end - Copy value to variables
NOTIF_API_URL
Example: NOTIF_API_URL=https://logs-prod-012.grafana.net/loki/api/v1/push
Copy value of Authentication -> User and paste it with variable NOTIF_API_BASIC_AUTH_USERNAME
Example: NOTIF_API_BASIC_AUTH_USERNAME=898189
Leave NOTIF_API_BASIC_AUTH_PASSWORD empty for now, you can't get it here
See Grafana documentation for more info
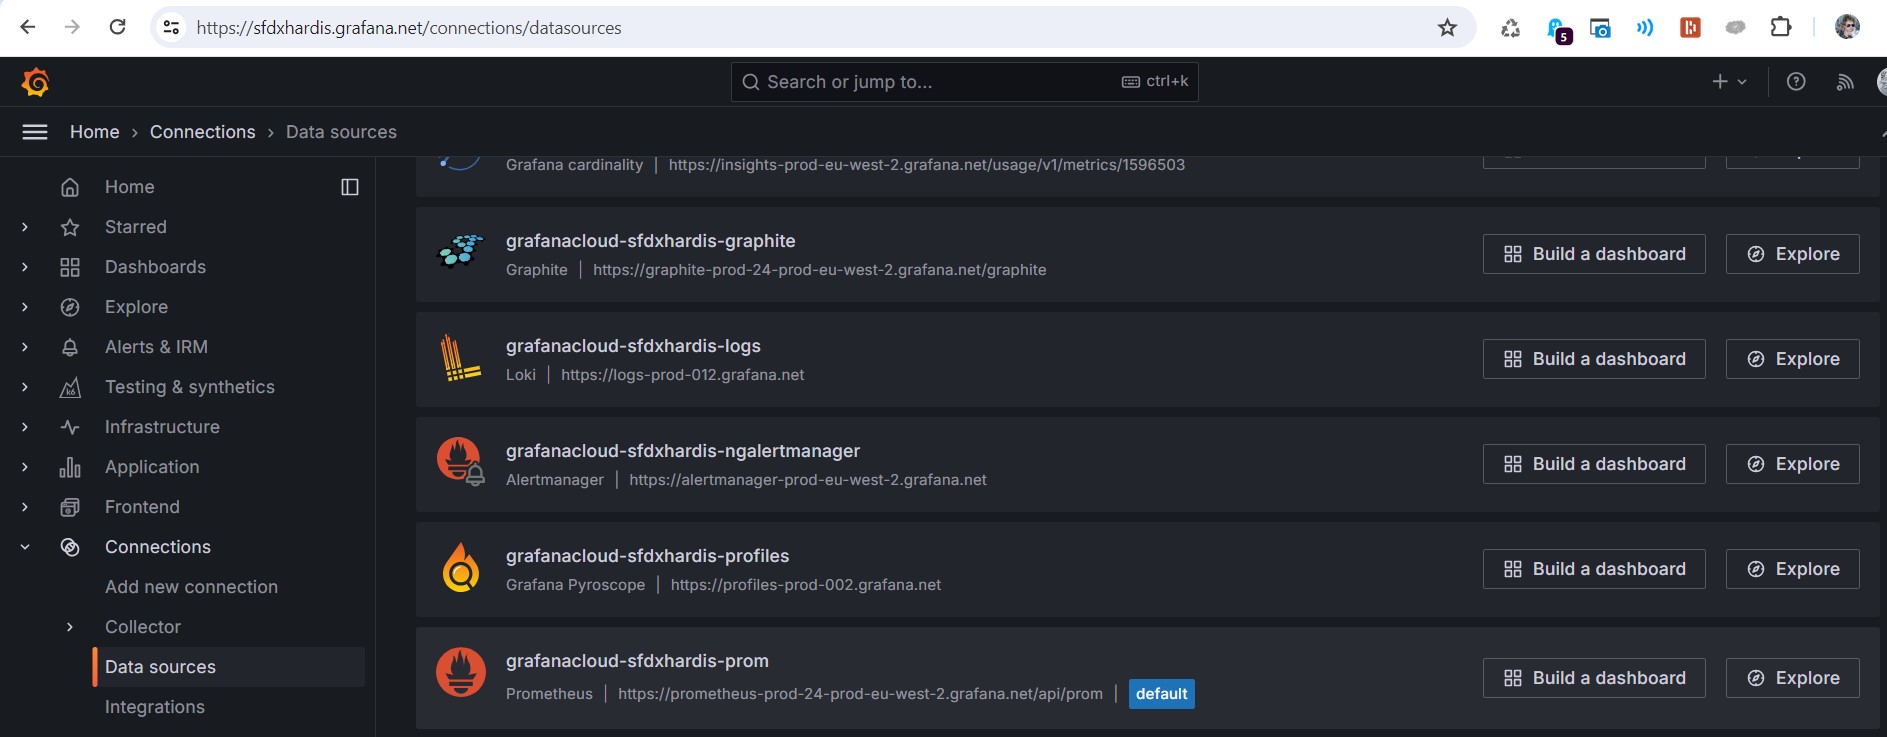
Get Prometheus configuration
Go to Connections -> Data Sources and click on grafanacloud-YOURORGNAME-prom (Prometheus)
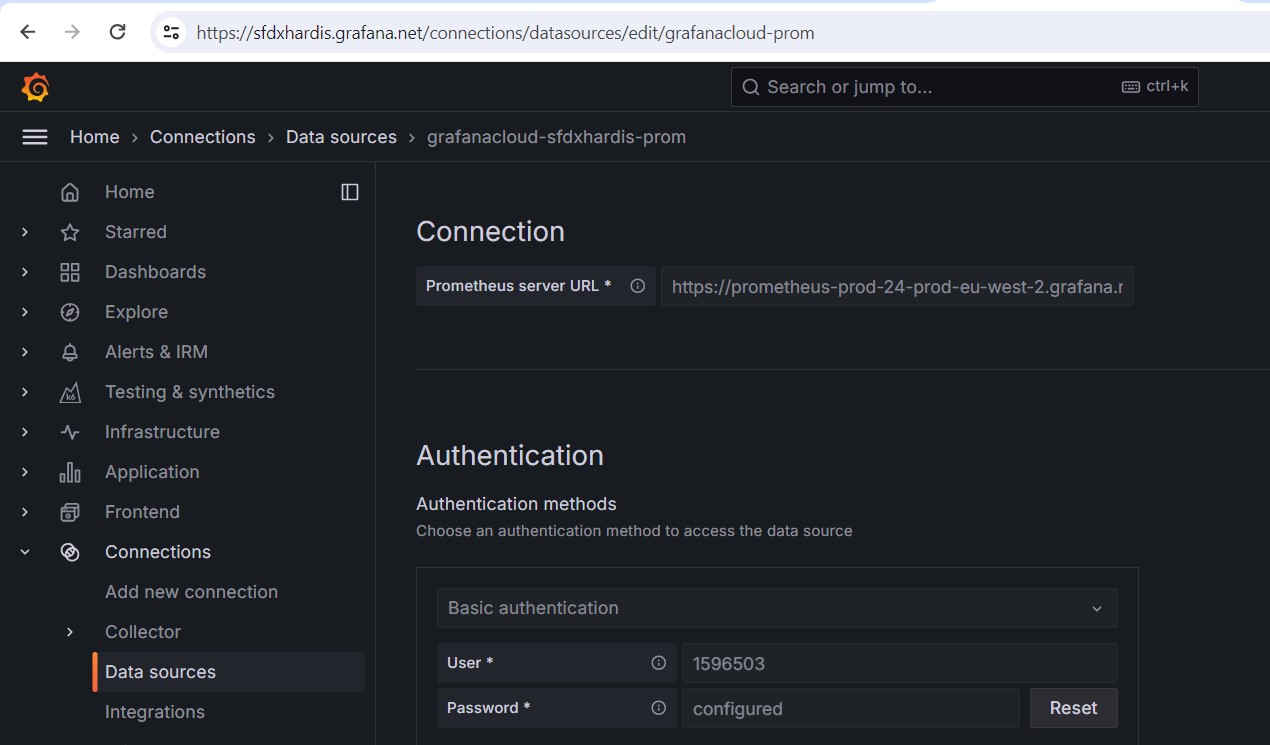
Build Metrics push url
- Copy value of Connection URL (something like
https://prometheus-prod-24-prod-eu-west-2.grafana.net/api/prom) - Replace
prometheusbyinflux - Replace
api/prombyapi/v1/push/influx/write - Then copy value to variables
NOTIF_API_METRICS_URL
Example: NOTIF_API_METRICS_URL=https://influx-prod-24-prod-eu-west-2.grafana.net/api/v1/push/influx/write
Copy value of Authentication -> User and paste it with variable NOTIF_API_METRICS_BASIC_AUTH_USERNAME
Example: NOTIF_API_METRICS_BASIC_AUTH_USERNAME=1596503
Leave NOTIF_API_METRICS_BASIC_AUTH_PASSWORD empty for now, you can't get it here
See Grafana documentation for more info
Create Service Account
Go to Administration -> Users and Access -> Cloud Access Policies, then click on Create Access Policy
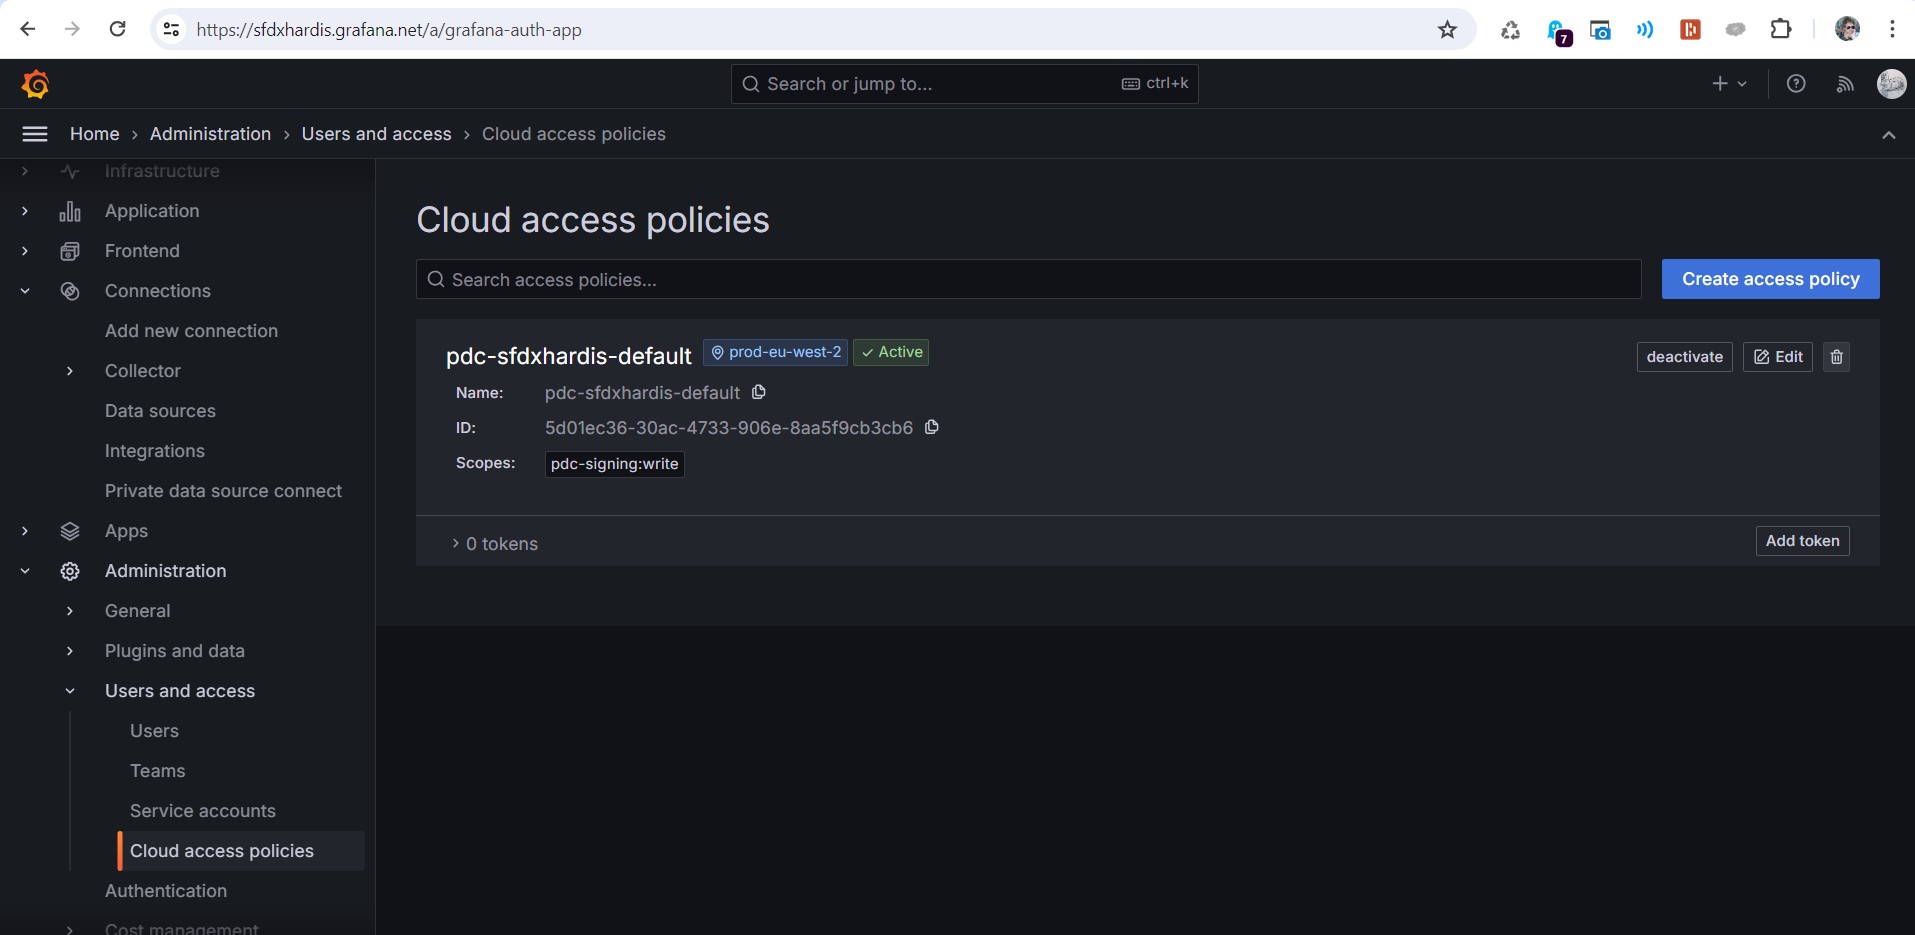
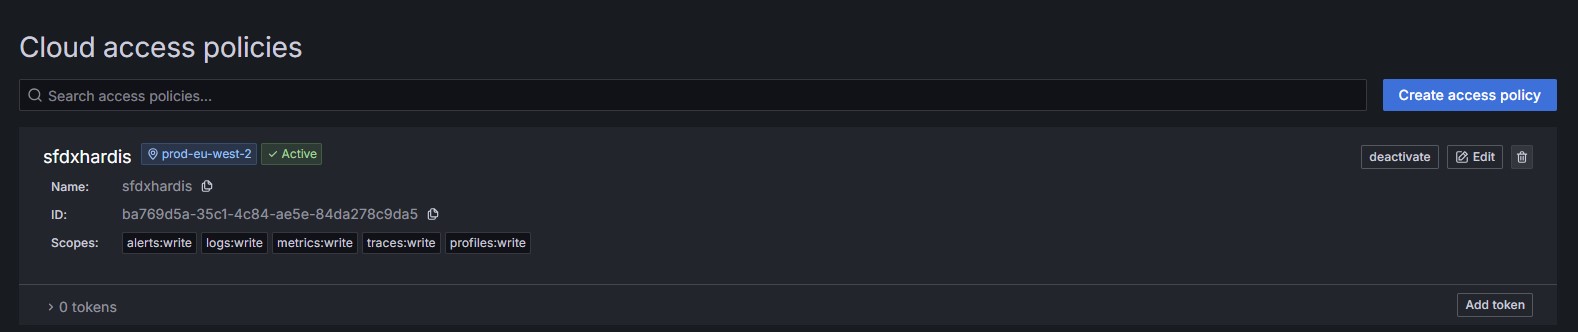
Create the access policy
- Define sfdxhardis as name and display name
- Select write for items metrics, logs, traces, profiles, alerts (only metrics and logs are used today, but who knows hat new features we'll release in the future !)
- Click on Create

On the new Access Policy sfdxhardis, click on Add Token at the bottom right
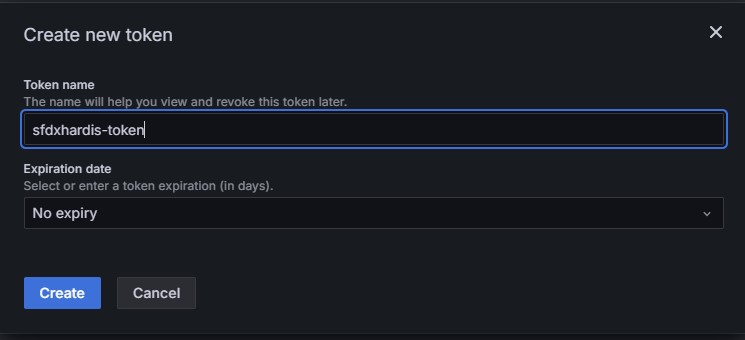
Name it sfdxhardis-token, let No expiration then click Create
On the next screen, click on Copy to clipboard then paste in your notepad in front of variables NOTIF_API_BASIC_AUTH_PASSWORD and NOTIF_API_METRICS_BASIC_AUTH_PASSWORD
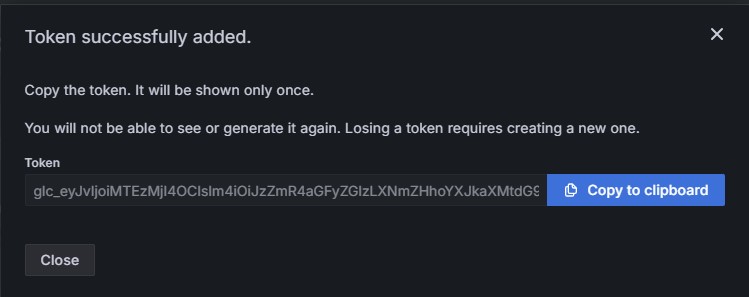
Example:
NOTIF_API_BASIC_AUTH_PASSWORD=glc_eyJvIjoiMTEzMjI4OCIsIm4iOiJzZmR4aGFyZGlzLXNmZHhoYXJkaXMtdG9rZW4iLCJrIjoiN0x6MzNXS0hKR1J5ODNsMVE5NU1IM041IiwibSI6eyJyXN0LTIifX0=
NOTIF_API_METRICS_BASIC_AUTH_PASSWORD=glc_eyJvIjoiMTEzMjI4OCIsIm4iOiJzZmR4aGFyZGlzLXNmZHhoYXJkaXMtdG9rZW4iLCJrIjoiN0x6MzNXS0hKR1J5ODNsMVE5NU1IM041IiwibSI6eyJyXN0LTIifX0=
Configure CI variables on repository
Now configure the 6 variables on the monitoring repository. (Ignore other paragraphs, except those who explain how to modify the pipeline YML to access protected variables)
Now you can force a run of your monitoring job (just add a dumb commit on a monitoring_xxxx branch to trigger it)
Optionally , you can look in the logs, you should see [ApiProvider] and [ApiMetricProvider] items.

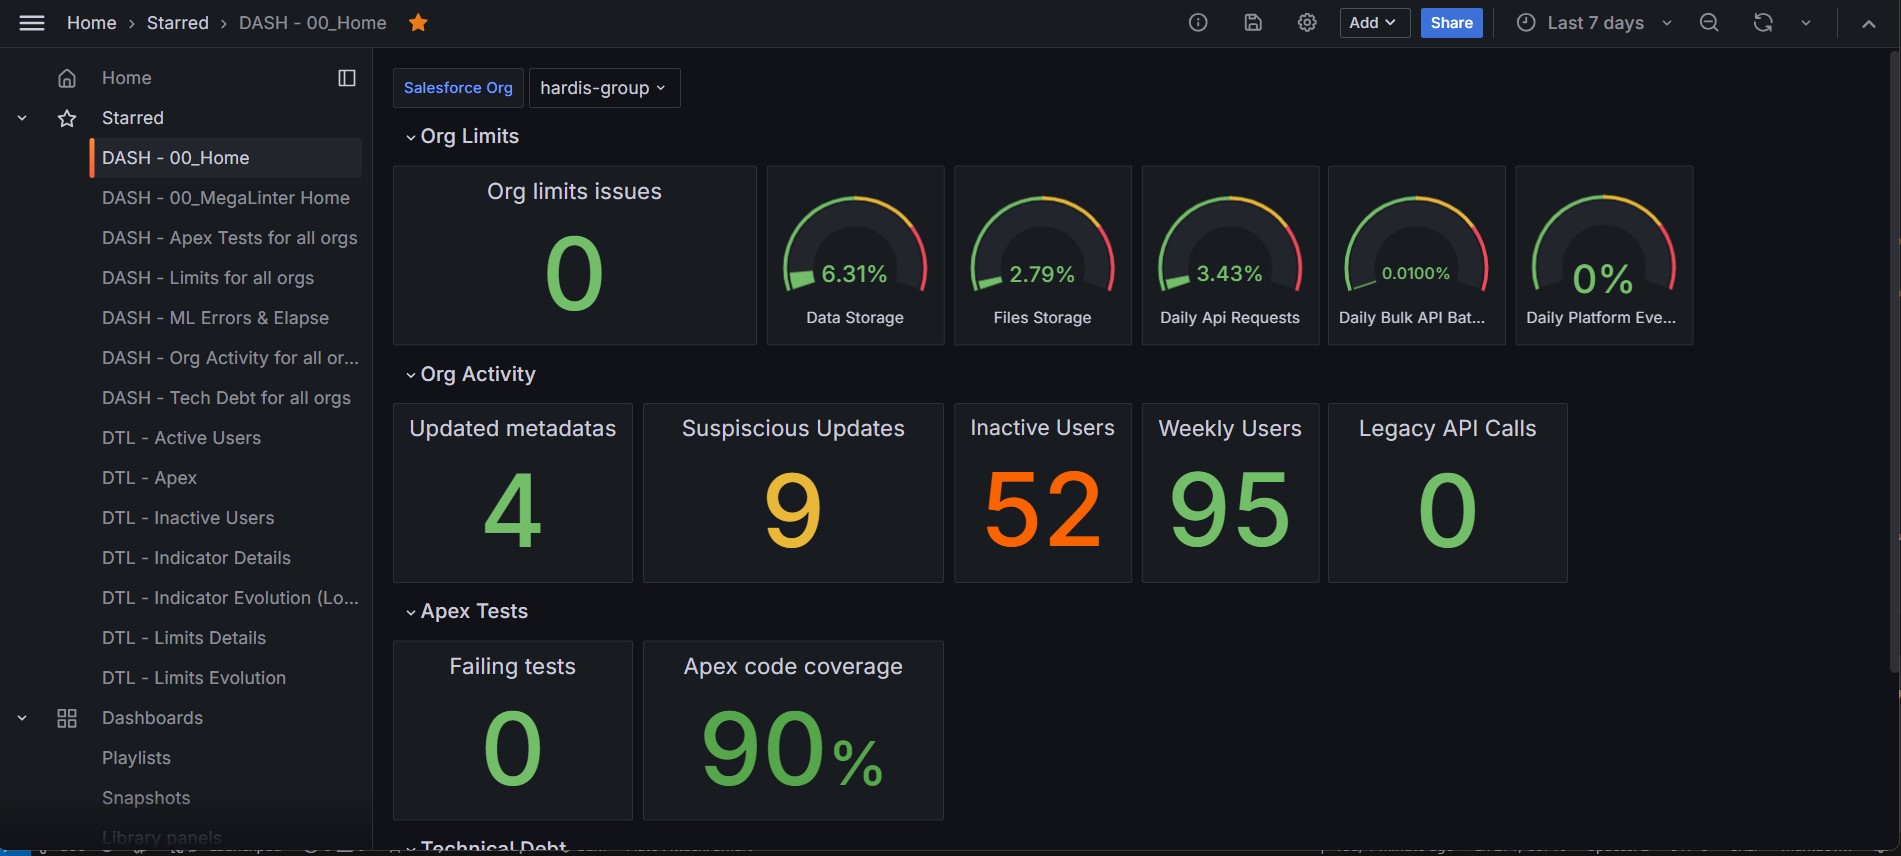
Download sfdx-hardis dashboards
Download all sfdx-hardis Dashboard JSON files from this sfdx-hardis repo folder

Create Dashboard folder
Go in menu Dashboards then click on New then New folder
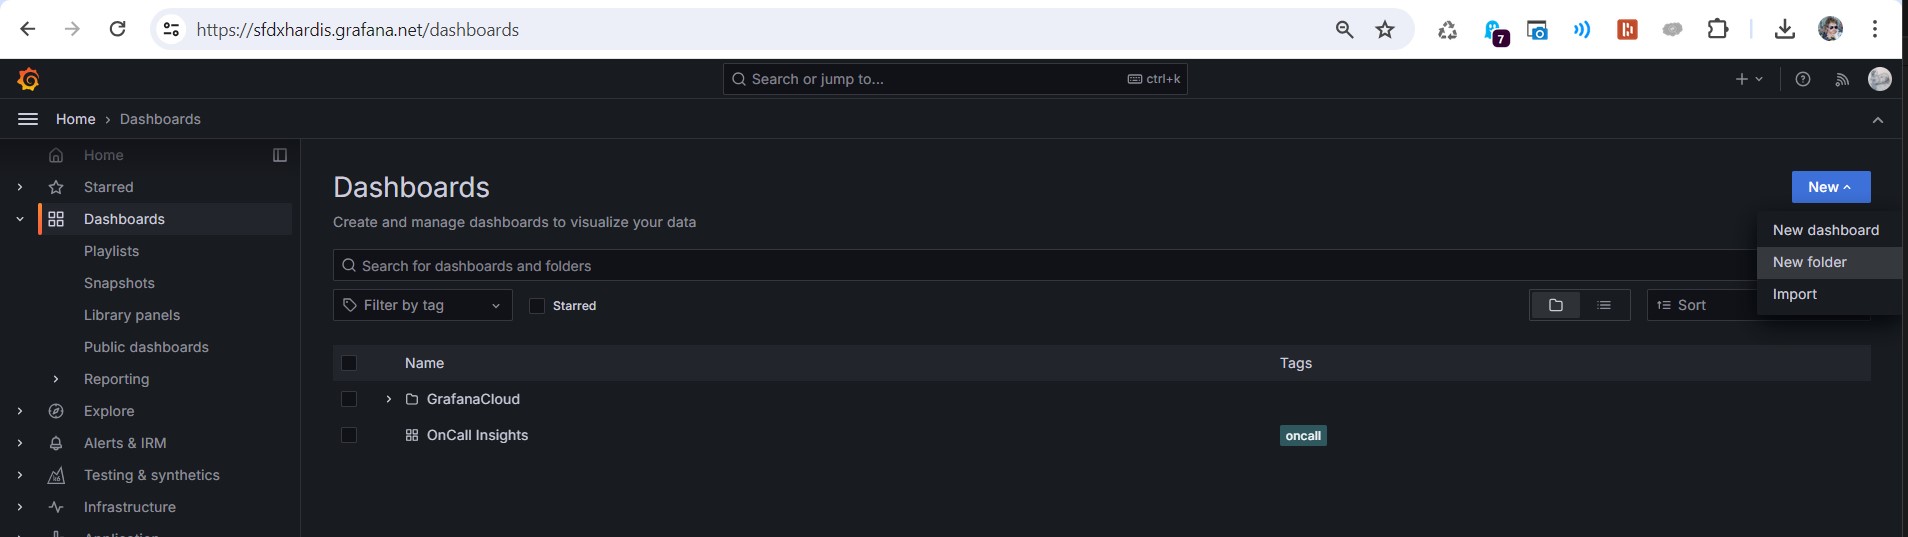
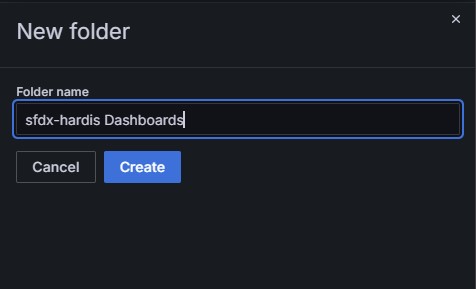
Create folder Sfdx-hardis Dashboards
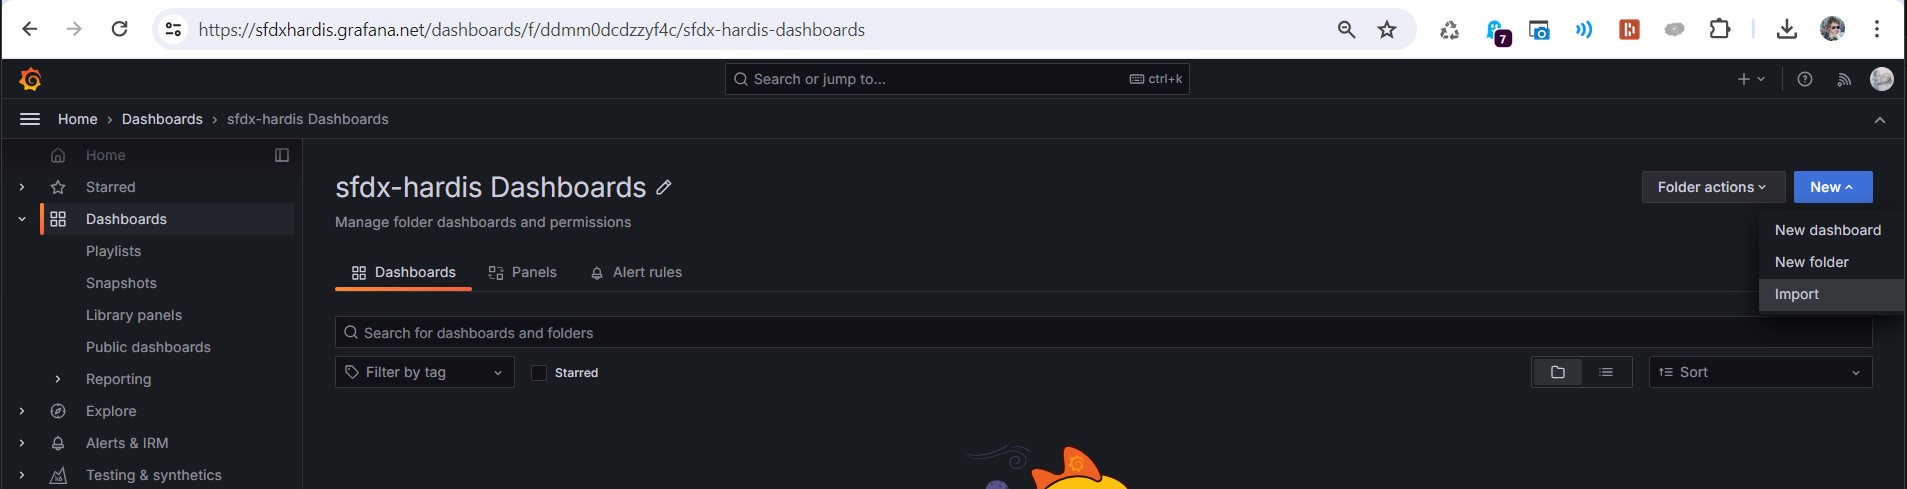
Import default sfdx-hardis Grafana Dashboards
For each downloaded Dashboard JSON file, process the following actions.
Click New then Import
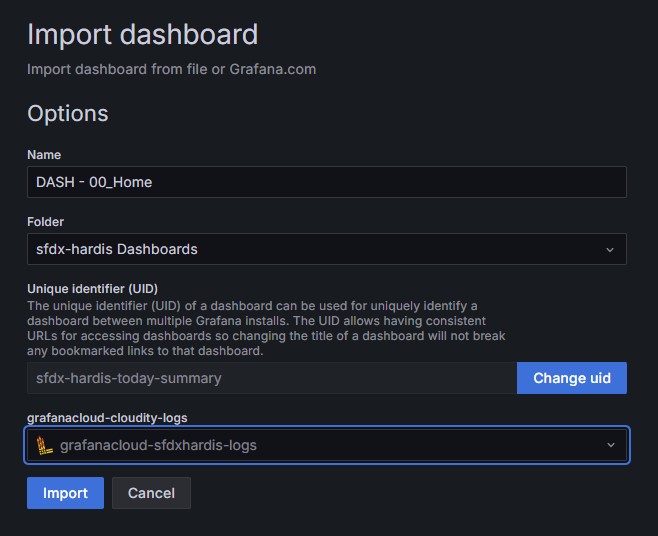
Click on Upload Dashboard JSON File and select one of the Dashboards JSON files you downloaded on your computer.
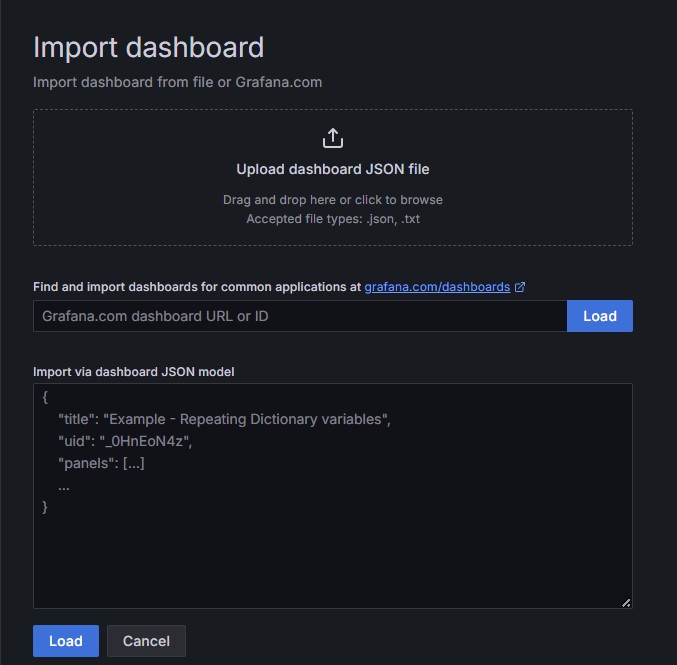
- Let Name, Folder and UID default values
- Select your Loki or Prometheus source. They can be:
- grafanacloud-YOURORGNAME-logs (Loki)
- grafanacloud-YOURORGNAME-prom (Prometheus)

Click Import
__
Repeat the operation for all Dashboard JSON files, and you're all set !